
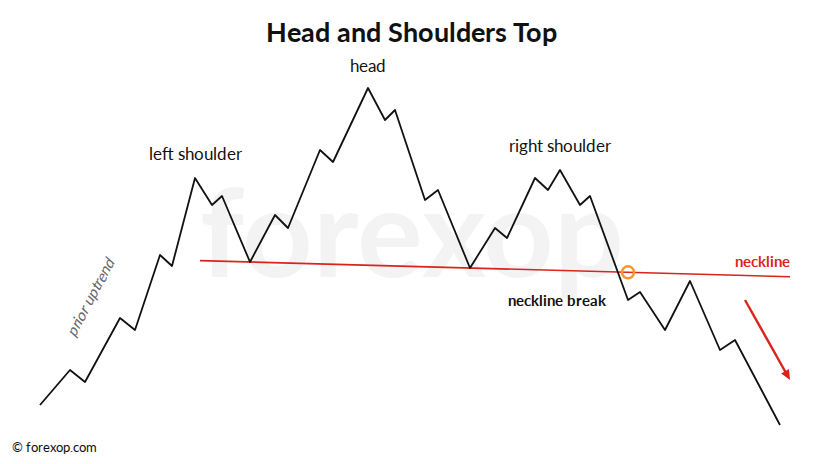
The head and shoulders gets its name from its shape. A peak (the left shoulder), a higher peak (the head) and a lower peak (the right shoulder). It forms at the top of an uptrend and signals a bearish reversal. The mirror image, the inverse head and shoulders, forms at the bottom of a downtrend and signals a bullish reversal.
It is a close relative of the double top and double bottom. But because it takes longer to form and has more moving parts, it tells you more about what buyers and sellers are doing.

What Is a Head and Shoulders Pattern?
A head and shoulders top has five parts:
- Prior uptrend: there has to be a trend to reverse. Without one, the pattern is just noise in a range.
- Left shoulder: a peak made during the uptrend, followed by a normal pullback.
- Head: the market rallies to a new high, then falls back to around the level of the first pullback.
- Right shoulder: a third rally that fails below the head. This is the first lower high in the trend.
- Neckline: a line drawn through the two lows between the peaks. It can be flat or sloped.
The pattern is not complete until the price closes through the neckline. Until then, what looks like a right shoulder could simply be a pullback in a trend that is still intact.
The Psychology Behind the Pattern
Chart patterns work (when they do) because they are a picture of crowd behavior. The head and shoulders tells a story of buyers slowly losing control.
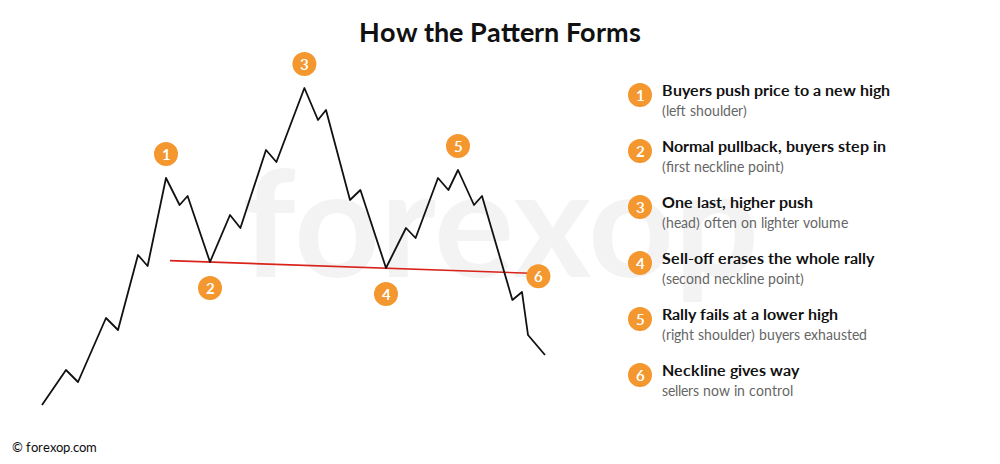

At the left shoulder (1) everything looks normal. Buyers are in control and the dip that follows (2) is bought, as dips in an uptrend usually are.
The head (3) is the last push. It often comes on lighter volume than the left shoulder. Fewer new buyers are joining, and the ones that do are late. Then the market falls all the way back to the previous low (4). This is the first real warning. The whole rally to the head has been wiped out.
The right shoulder (5) is a relief rally. Traders who missed the head see a chance to buy the dip. But the rally fails before reaching the old high. That lower high is the moment the trend breaks down. When the neckline gives way (6), everyone who bought at the head or right shoulder is now losing money. Their stop losses and exit orders add fuel to the decline.
How to Identify a Valid Head and Shoulders
Real charts are never as tidy as diagrams. The pattern will rarely be perfectly symmetrical and that’s fine. What matters is the basic structure. Use this checklist:
- A clear prior trend. The pattern should form at the top of a meaningful rally. A head and shoulders in the middle of a sideways range doesn’t mean much.
- The head stands out. The head should be clearly higher than both shoulders, not just a few pips higher.
- Shoulders roughly level. The two shoulders should be at a similar height. As a rule of thumb, the difference should be less than about a third of the pattern’s height.
- Rough balance in time. The right side shouldn’t take five times as long to form as the left side. It doesn’t need to be exact.
- A neckline you can draw. The two lows should line up. A steep neckline makes the pattern less clear.
- A close through the neckline. An intraday spike through the line isn’t enough.
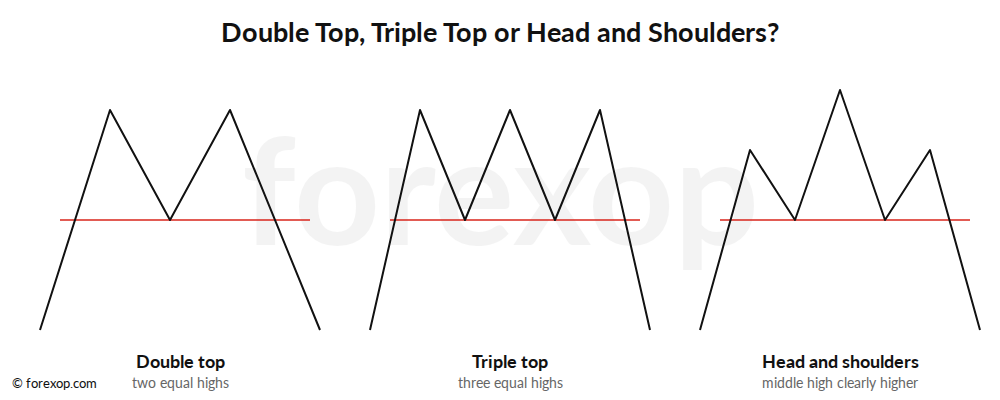
It’s easy to confuse the head and shoulders with double and triple tops. The difference is the middle peak. In a double or triple top, the highs are at about the same level: the market is hitting a ceiling. In a head and shoulders, the middle high is clearly higher, and the right shoulder is the first failure.

Volume
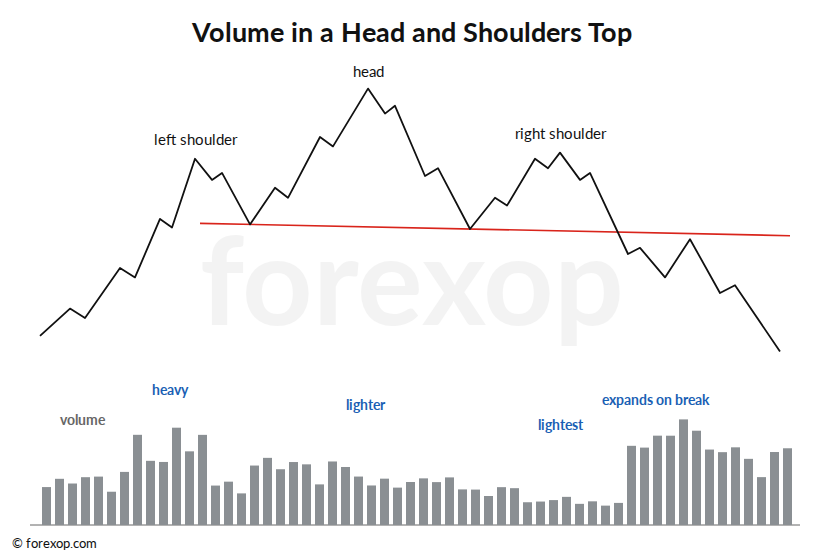
In the classic textbook pattern, volume is heaviest on the left shoulder, lighter on the head, and lightest on the right shoulder. Then it expands sharply as the neckline breaks. Falling volume on each rally shows that fewer and fewer buyers are willing to push the price up.

In spot forex there is no central exchange, so there is no true volume. You can use tick volume from your trading platform as a rough guide, or the volume in the equivalent currency futures contract. Don’t reject a pattern just because volume doesn’t match the textbook. But a neckline break on strong volume is more convincing than one that drifts through on no activity. See directional volume breakouts for more on using volume with breakouts.
Sloping necklines
The neckline doesn’t have to be horizontal. The slope tells you something about the balance between buyers and sellers.
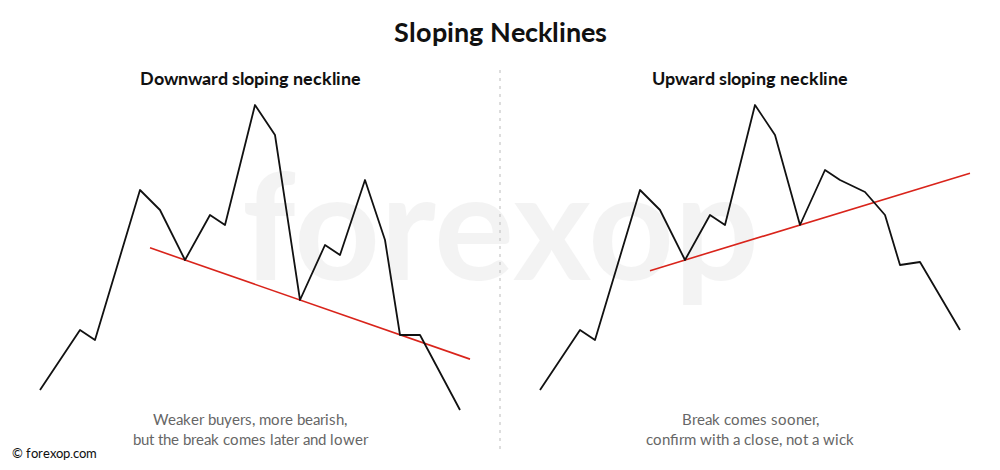

A downward sloping neckline in a top means the second low was lower than the first. Buyers are already weaker, so it’s a more bearish setup. The downside is that the break comes later and at a lower price, so you give up some of the move.
An upward sloping neckline means buyers were still defending higher lows. The break comes sooner, but the market is not as weak. With a rising neckline, it’s even more important to wait for a close through the line rather than reacting to a wick.
The Inverse Head and Shoulders
The inverse head and shoulders (also called a head and shoulders bottom) is the same pattern turned upside down. It forms after a downtrend and signals a bullish reversal. Three lows, with the middle low deepest, and a neckline drawn across the two highs between them.
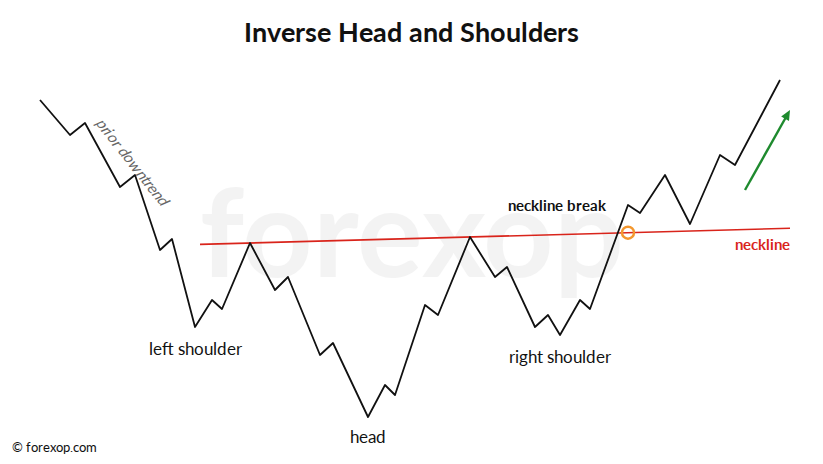

Everything in this guide applies to the inverse pattern, just flipped: buy on the break above the neckline, stop below the right shoulder, and project the target upward.
One difference is volume. Markets can fall under their own weight, but they need buying to rise. That’s why a volume increase on the neckline break is more important with inverse patterns. Interestingly, the inverse pattern has also been the more reliable of the two in our currency tests (see the study below).
How to Trade the Head and Shoulders
Entry
There are three main ways to enter. Each trades a better price for less confirmation.
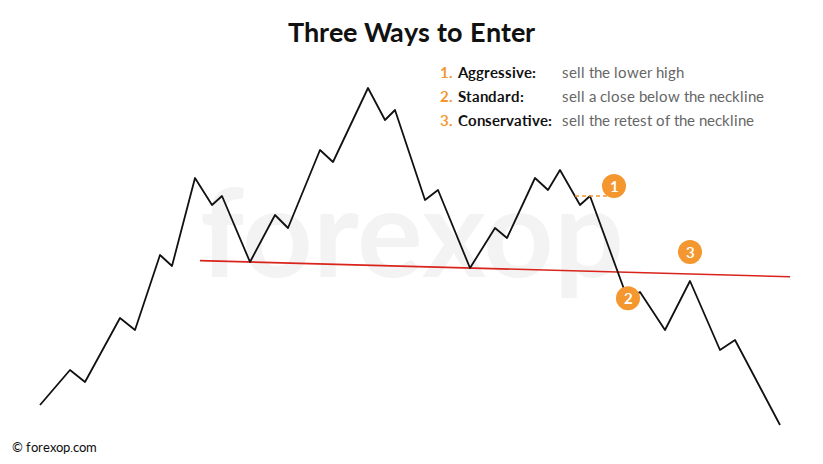

1. Aggressive: the right shoulder. Sell when the right shoulder turns lower, for example on a break of the minor swing low within the shoulder. This gives the best price and the smallest stop. But the neckline hasn’t broken, so there is no confirmation that the pattern is real. Many “right shoulders” turn into new rallies.
2. Standard: the neckline close. Sell when a candle closes below the neckline. This is the classic entry. The pattern is complete, but the price is further from the stop, so the risk-reward is weaker.
3. Conservative: the retest. After a break, the price often rallies back to test the neckline from below. Old support becomes new resistance. Selling the retest gives a better price than the break, with a tight stop just above the neckline. The catch is that not every break retests. Strong moves can leave you behind.
You can place a pending order for either the neckline break (a sell stop just below the line) or the retest (a sell limit just below the line). Give it an expiry date so an old order doesn’t fill weeks later when the setup is no longer valid. The retest breakout system covers the retest entry in more detail.
Stop loss
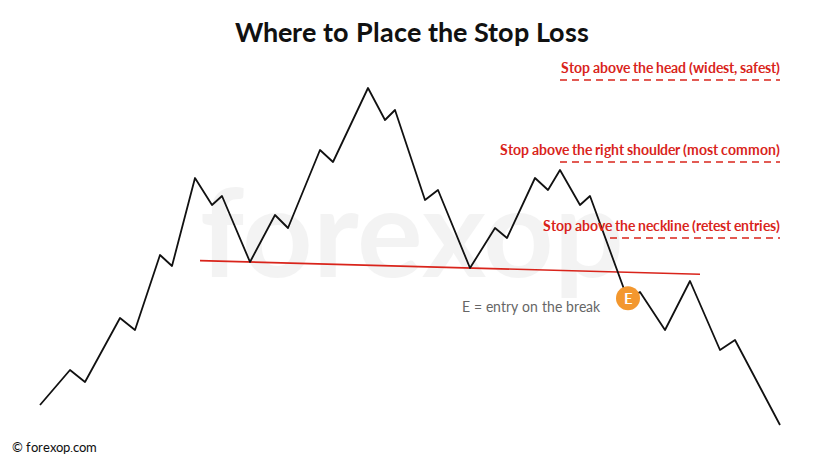

Above the right shoulder is the most common choice. If the price rallies back above the right shoulder, the lower high is gone and the pattern has failed.
Above the head is the safest but widest stop. It’s only reached if the uptrend resumes completely. The problem is that it often makes the risk bigger than the expected profit.
Above the neckline (plus a buffer) works for retest entries. If the price closes back above the neckline after a retest, the break has failed. Leave room for normal noise: a buffer of half to one times the average true range helps you avoid getting stopped out by a single wick.
Profit target
The standard target is called the measured move. Measure the vertical distance from the head to the neckline (the height, H). Then project that distance down from the point where the price breaks the neckline.
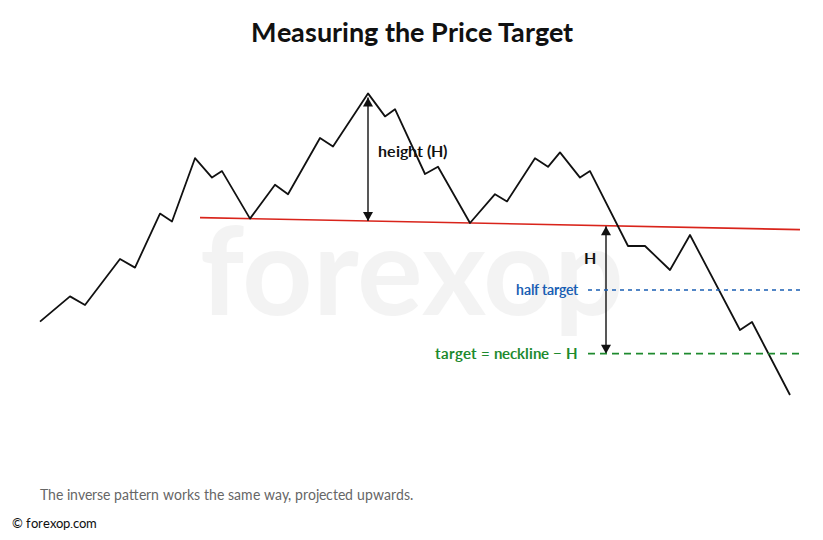

Target = neckline at the break − H (for an inverse pattern: neckline + H)
For example, if the head is at 1.1500 and the neckline is at 1.1200, then H is 300 pips. A break at 1.1200 gives a target of 1.0900.
Treat the target as a guide, not a promise. As our study shows, the full target is reached less than half the time for tops. Many traders take partial profits at the half-target and let the rest run with a trailing stop.
Risk-reward and position size
Do the numbers before you enter. With a neckline-close entry and a stop above the right shoulder, the distance to the stop is often about the same as the distance to the target, roughly 1:1. That’s not a great bet on its own when the target is reached less than half the time.
There are three ways to improve it:
- enter earlier (right shoulder) or on the retest, so your entry is closer to the stop
- take partial profit at the half-target, then move the stop to break-even
- skip patterns where the risk-reward is poor, such as a very tall right shoulder
Size the position so a stop-out costs a fixed small share of your account. The Money Management Advisor works out the lot size for a given stop distance, and the Stop Loss and Take Profit Optimizer can help you test stop and target combinations.
Example: GBP/JPY Head and Shoulders Top (2007)
The GBP/JPY weekly chart in 2007 shows a textbook head and shoulders top. It formed at the peak of the carry trade boom, just as the credit crisis was starting.
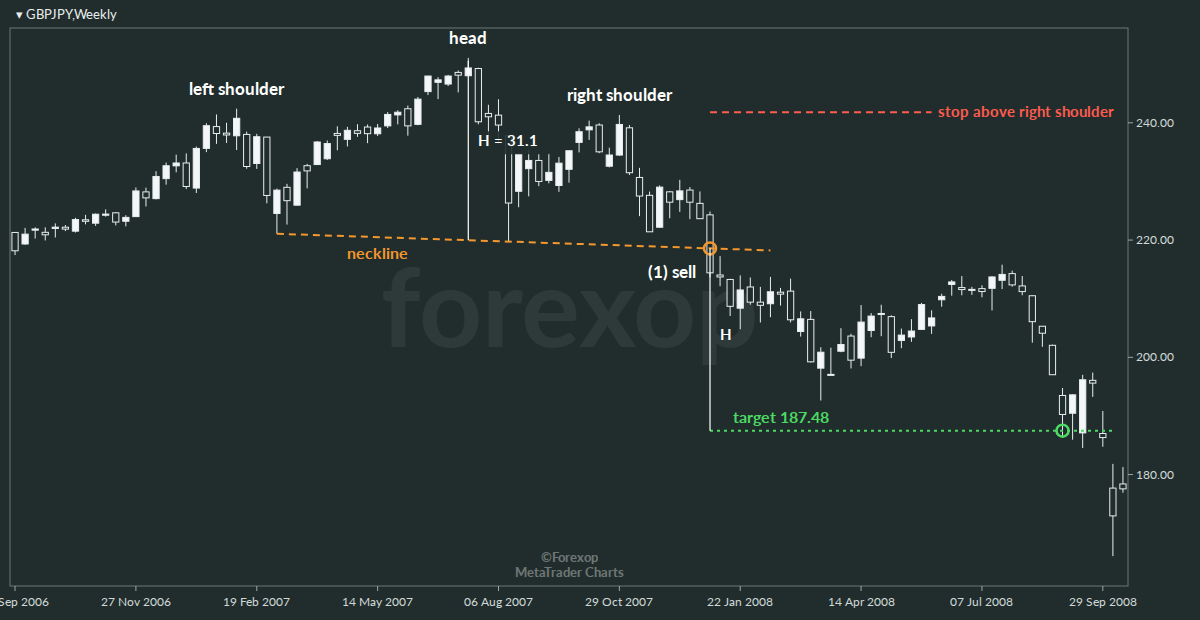

The left shoulder formed in February 2007 at 242.41, and the pullback in March found support at 221.07. The rally to the head took the pair to 251.08 in July. In August the market collapsed back to 219.74, which marked the second neckline point. The right shoulder in October stalled at 241.34, below the head.
The neckline was almost flat, sloping slightly lower. The weekly candle of 31 December 2007 closed at 214.41, below the neckline at about 218.6. That was the sell signal (1).
The height from the head to the neckline was 31.1 yen. Projected down from the break, that gave a target of 187.48. The market took its time. It spent months moving sideways between about 193 and 217 and never came back to the neckline. The target was finally reached in the first week of September 2008, just before the market fell even further in the autumn crash.
Notice the risk-reward. Selling at the close of 214.41 with a stop above the right shoulder at around 241.8 meant risking about 27 yen to make about 27 yen. The trade worked, but it’s a reminder of how wide the stops on a big pattern can be. Also notice that there was no retest. A trader waiting for one would have missed the entire move.
Example: USD/JPY Inverse Head and Shoulders (2011-2013)
USD/JPY formed a large inverse head and shoulders over nearly two years before the big rally of 2013.
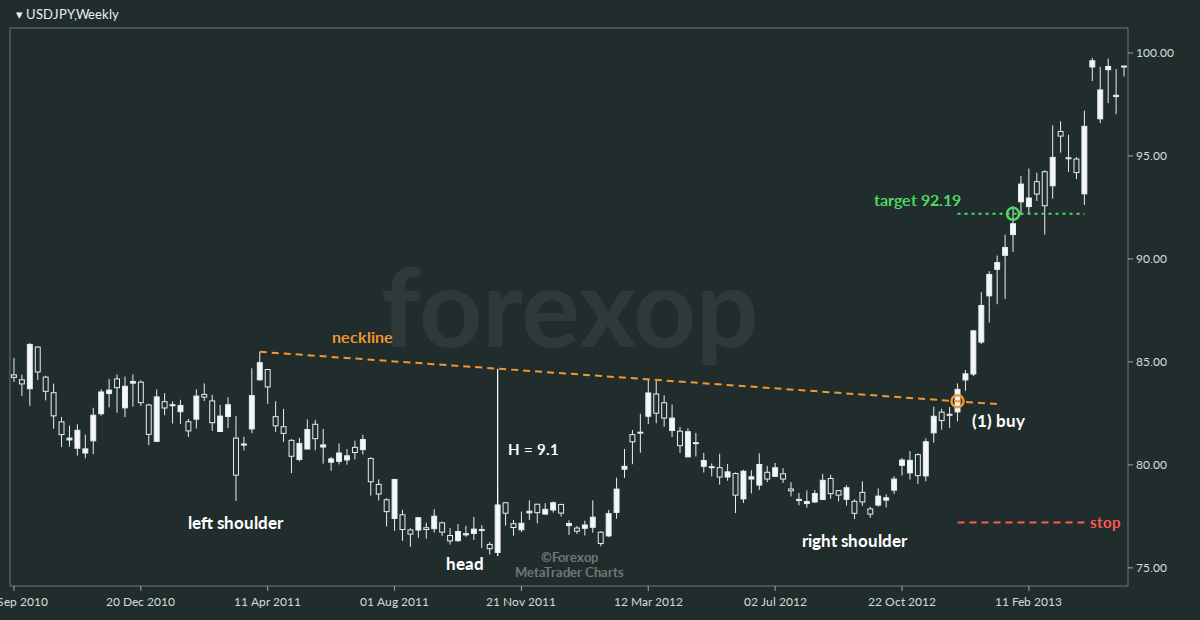

The left shoulder formed in March 2011, in the turmoil after the Japanese earthquake. The yen kept strengthening and the dollar made a record low below 76 yen in October 2011 (the head). The right shoulder bottomed at 77.37 in September 2012, a clearly higher low.
The neckline ran from 85.49 (April 2011) to 84.15 (March 2012), a gently downward sloping line. In December 2012, with the Japanese election campaign promising aggressive monetary easing, the pair closed at 83.67, above the neckline at about 83.1 (1).
The height of the pattern was about 9.1 yen, giving a target of 92.19. It was reached by the end of January 2013, only seven weeks after the break. The rally didn’t stop there, and USD/JPY went on to trade above 100 by May. With a stop below the right shoulder at 77.20, this trade risked about 6.5 yen to make about 8.5 yen, before any trailing stop.
Again, there was no retest of the neckline. When a pattern is driven by a major change in fundamentals, the break can be one-way.
When the Pattern Fails
No chart pattern works every time. A failed head and shoulders usually follows a familiar path. The price breaks the neckline, but instead of following through, it closes back on the other side. Then it takes out the right shoulder and the stop.
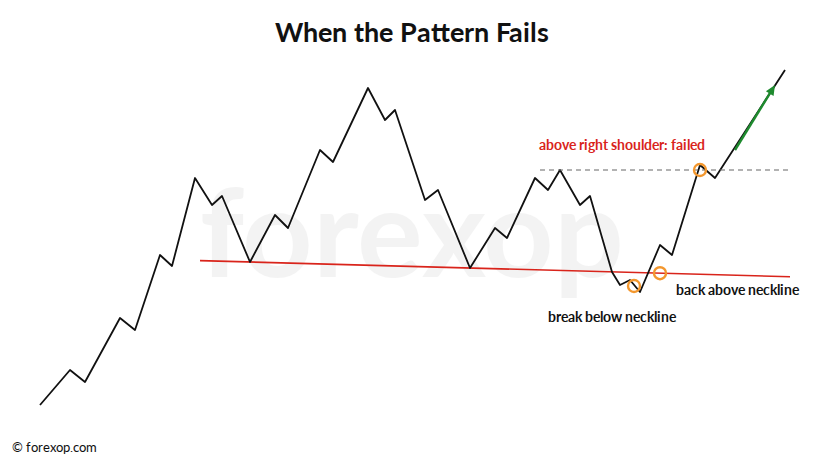

The warning signs are:
- a break that doesn’t follow through within a few bars
- a close back through the neckline, which is the most important warning
- a break against the direction of the higher timeframe trend
When a head and shoulders top fails, the traders who sold the break are trapped. Their stops sit just above the right shoulder, and when these are hit, the buying can fuel a sharp rally. That’s why failed patterns can be good trades in their own right. See fading the fakeout and contrarian patterns.
Real example: AUD/USD failed inverse head and shoulders (2024)
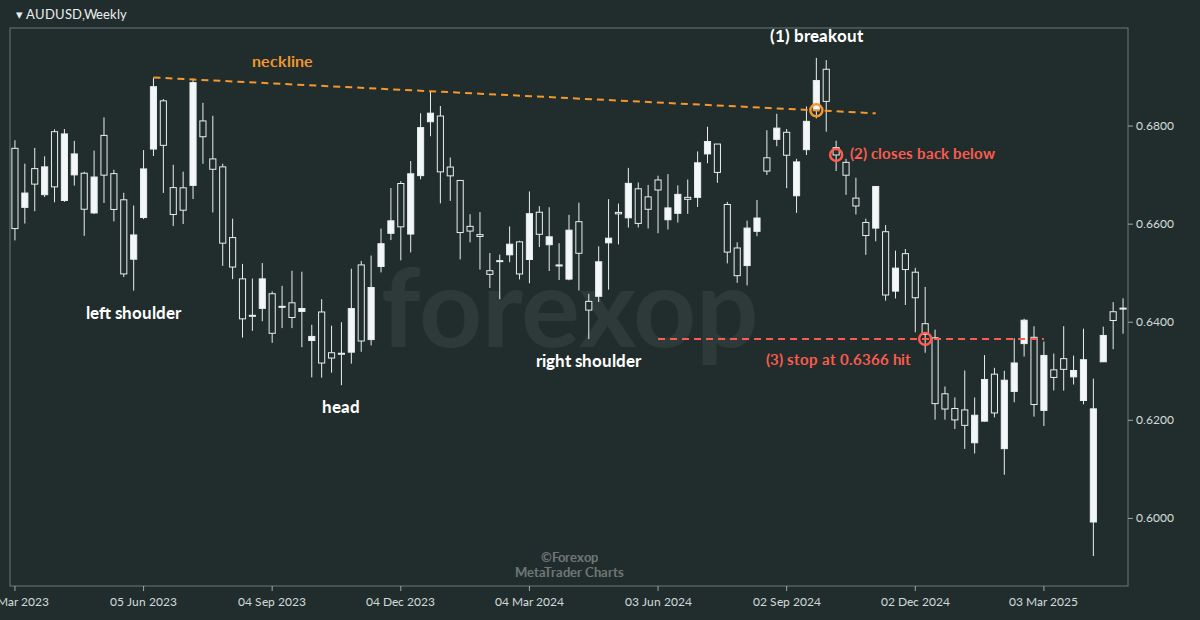

AUD/USD spent most of 2023 and 2024 building what looked like an inverse head and shoulders. The left shoulder was at 0.6464 (May 2023), the head at 0.6272 (October 2023) and the right shoulder at 0.6366 (April 2024). The neckline ran across the highs near 0.6899 and 0.6871.
In the week of 23 September 2024 the pair closed above the neckline at 0.6893 (1). The target was around 0.7440. The breakout peaked within days at about 0.6940. Two weeks after the break it closed back below the neckline (2), the first sign of trouble. By December 2024 the price had fallen through the right shoulder, hitting the stop (3). It then went on to break below the head.
A trader who exited when the price closed back below the neckline would have lost only a fraction of the full stop. That’s the value of watching the neckline after the break, rather than just waiting for the stop.
How Reliable Is the Head and Shoulders? Our FX Study
Many websites claim success rates of 80% or more for the head and shoulders. The best known independent research, by Thomas Bulkowski, is more modest. In US stocks, he found that head and shoulders tops reached their measured target 51% of the time, while inverse patterns reached it 71% of the time.
Stocks are not currencies, so we ran our own test on FX data:
- Markets: 19 currency pairs (majors and crosses) plus gold, daily charts, January 2005 to September 2026
- Detection: a fixed set of rules to find swing highs and lows, then the checklist above: a prior trend, the head clearly beyond both shoulders, shoulders and neckline points roughly level, and reasonable balance in time
- Entry: the first daily close through the neckline
- Stop: beyond the right shoulder
- Target: the measured move
The rules found 102 completed patterns: 53 tops and 49 inverse patterns.
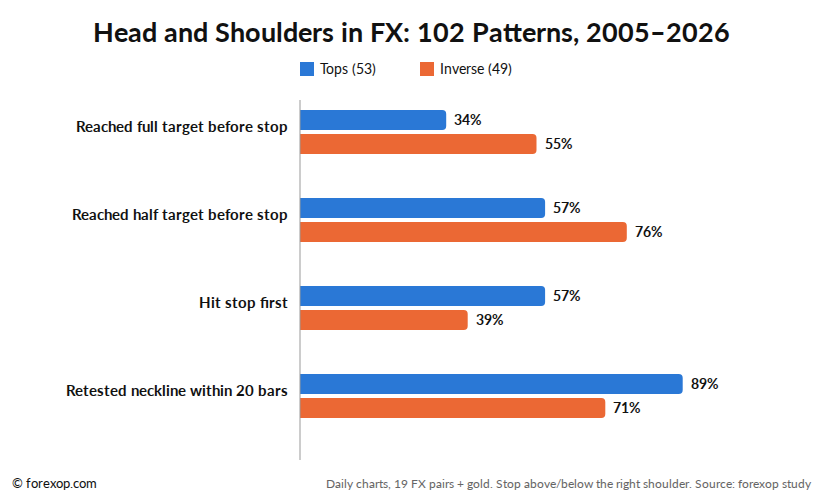

What the results say:
- Inverse patterns did much better than tops. The inverse pattern reached its full target before the stop 55% of the time, against just 34% for tops. This matches Bulkowski’s findings in stocks, where bottoms also beat tops.
- The half-target is realistic. 57% of tops and 76% of inverse patterns reached half their target before hitting the stop. This supports taking partial profits halfway.
- Retests are common. 89% of tops and 71% of inverse patterns came back to touch the neckline within 20 trading days of the break. On daily charts, waiting for the retest usually gets you a better entry. The two weekly examples above show that the exceptions tend to be the biggest moves.
- Tops fail often. 57% of tops hit the stop above the right shoulder before reaching the full target. On their own, head and shoulders tops in FX are far from a sure thing.
Keep the limits of this test in mind. 102 patterns is a small sample, and the results depend on the rules used to define the pattern. It also ignores spreads and swap costs. Treat it as a reality check, not a trading system.
Common Mistakes
- Trading before the neckline breaks. Until then, it’s a possible pattern, not a pattern.
- Seeing the pattern everywhere. Any three bumps can look like a head and shoulders if you want them to. Insist on a prior trend and a clear head.
- Stops that are too tight. Volatility rises around reversals, and whipsaws around the neckline are normal. Use the ATR to allow for this.
- Ignoring the bigger picture. A head and shoulders on a 15-minute chart means little if the daily trend is strongly up. Check the higher timeframe.
- Expecting the full target every time. Plan your exits around what the pattern usually does, not what it does at its best.
- Holding on after a failed break. A close back through the neckline is information. Act on it.
Head and Shoulders FAQ
Is a head and shoulders bullish or bearish?
A head and shoulders top is bearish: it signals the end of an uptrend. The inverse head and shoulders is bullish: it signals the end of a downtrend.
What usually happens after a head and shoulders pattern?
After the neckline breaks, the price often moves in the direction of the break. It commonly pulls back to retest the neckline first. In our FX study, most patterns reached at least half of their measured target. Only around a third of tops reached the full target.
Which timeframe works best?
The pattern appears on every timeframe, but it is more meaningful on daily and weekly charts. Patterns on short intraday charts form quickly and are affected more by random noise and news spikes.
What if the right shoulder is higher than the left?
That’s fine as long as it’s still clearly below the head. A higher right shoulder does make the risk bigger, because the stop is further away. A right shoulder that is much lower than the left shows sellers are already strong.
Can a head and shoulders be a continuation pattern?
Occasionally. The shape can form as a consolidation within a trend and break out in the trend’s direction. These are much less common. As a rule, if there’s no prior trend to reverse, don’t treat the pattern as a reversal signal.
For more patterns, see the chart pattern cheat sheet and the cup and handle guide. For another way to read tops and bottoms, try Wyckoff analysis.

Grid Trading
Definitive Guide
This ebook is a must read for anyone using a grid trading strategy or who's planning to do so. Grid trading is a powerful trading methodology but it's full of traps for the unwary. This new edition includes brand new exclusive material and case studies with real examples.