

This method is used by many types of market participants, from individual technical traders through to analysts at the world’s largest financial institutions such as Citigroup, as seen for example here.
In this tutorial I want to take a step back from all of the hype. I will take an objective look at Fibonacci retracement to see if it actually lives up to its reputation as a predictive tool.
What I will do here is quantitatively measure if reversals around these Fibonacci lines occurs with a higher probability than can be explained by chance alone. If they can be explained by chance alone, then we have to conclude that using these reversal lines as a trading signal is no better than picking lines at random. In other words, the whole idea is a myth.
Fibonacci Basics
To start with let’s have a quick recap of what Fibonacci retracement is and what it claims to do.
Fibonacci retracement levels are calculated by using the ratios obtained through a Fibonacci sequence. In essence these are widely assumed to be better entry points in the direction of the trend, compared to other levels.
The levels obtained through the use of a Fibonacci sequence are 23.6 %, 38.2 %, 61.8 % and 76.4 %. In addition the level of 50% was added to this set, because it is assumed to be a psychologically important support level. For a more indepth explanation see here.
The chart in Figure 1 shows how Fibonacci retracement works during a typical up-trend.

The solid blue lines mark the Fibonacci distances. Technical traders consider these to be “zones” where reversals are more likely to occur.
It is not clear who first applied Fibonacci levels to financial trading. There are some indications that the concept was developed after the invention of Elliott Wave Theory in 1930s. In addition, I found no strong philosophy on why these levels should be so important in global financial markets.
With any charting technique, there’s a human tendency to look at the chart and only see cases where the rule holds. We ignore the multitude of cases where the rule doesn’t hold.
These are the two main explanations offered by various technical analysts:
- Fibonacci ratios are often observed in the nature. Therefore they should be important in financial markets as well.
- The fact that a large number of market participants use Fibonacci retracement levels makes them self-fulfilling.
However I don’t find either of these explanations at all convincing. That is probably why I have never used them in my trading career.
Exposing the Fibonacci Myth
In this section I’ll present some of my back testing results so that you can make up your own mind. Within this test I’ll compare the classic Fibonacci retracement levels with various other retracement levels to see if there is a significant difference. I’ll do this for the G10 currencies versus the USD.
Test on G10 FX pairs
In this test I have used 1 minute bar (High, Low, Open, Close) data from 01, October 2003 to 07, May 2016 for the following G10 currency pairs.
- EURUSD
- GBPUSD
- USDJPY
- USDCHF
- USDCAD
- AUDUSD
- NZDUSD
- USDSEK
- USDNOK
The source of the data is the website of Swiss bank Dukascopy. In total, there are 6,625,980 minutes including week-ends in the chosen period. Bid prices were used in this analysis.
Defining waves and corrections
To define the Fibonacci retracement levels during an up-trend, we need to pick an appropriate major minimum and maximum of the wave that is experiencing a correction. In order to do that I have adopted the following rules.
- Any correction of the up (down) wave X can not be bigger than the biggest previous down (up) wave that ends at the minimum (maximum) from where wave X starts.
- If wave Y is a downward (upward) correcting wave then the major minimum (maximum) for drawing the Fibonacci retracement will be the end point of the most recent down (up) wave that is larger than wave Y.
Figures 2a and 2b visualize the above rules.


The Algorithm of the Test
In order to get all waves and corresponding corrections I performed the following steps programatically.
First Breakdown of the Chart – Figure 3a
- Find the largest wave on the chart, which is the one that connects the highest point and the lowest point. For EURUSD (2003 -2016) this is the wave 1 shown in yellow on figure 3a
- Find the previous largest (wave 2 on figure 3a) and next largest (wave 3 on figure 3a) waves.
- Continue step 2 until the waves reach the end points of the chart.
Second Breakdown of the Chart – Figure 3b
The next step is to get the largest correcting wave for each wave that we have found as a result of the first breakdown. The example shown in Figure 3b is the breakdown of the wave 1. The largest correcting wave of the wave 1 is the wave Y. By obtaining the largest correcting wave Y we can breakdown the wave 1 into three waves – X, Y and Z. After doing this I calculate the correction size in % by dividing the length of Y on the length of X.
Further Breakdown of the Chart – Figure 3c
I repeat the breakdown described in the previous section until the waves become smaller than the minimum correction sizes shown in Table 1 (last column). The further breakdowns of waves X, Y, Z of Figure 3b are shown in Figure 3c.


Summary of the Test
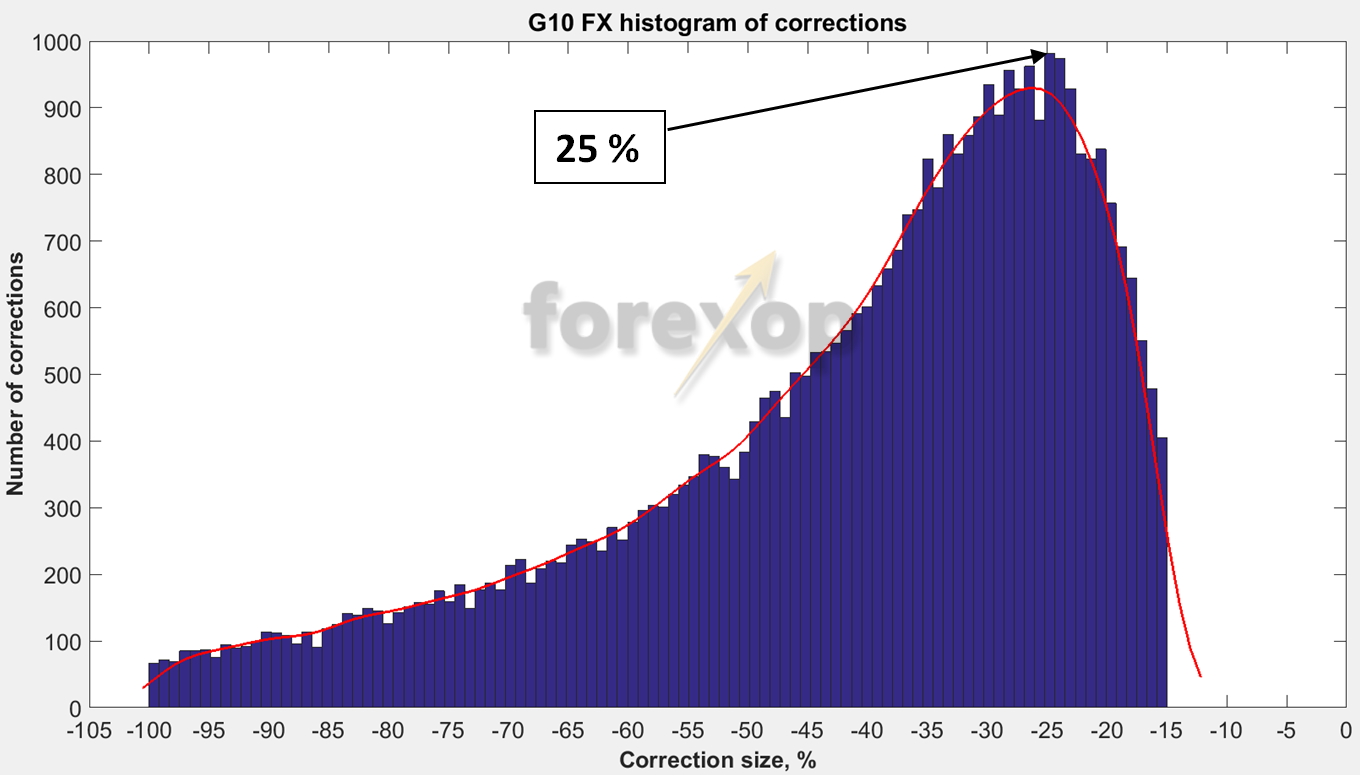
Figure 4 shows the histogram of all correction sizes for G10 currency pairs with USD. I took those waves that have a length greater than approximately 1% of the value of the currency. Exact thresholds for minimum wave sizes in pips for all currency pairs are shown in Table 1 (column 3). In my results I discuss only corrections that are greater than 15 %, which is lower than the 1-st Fibonacci retracement level of 23.6 %.
My conclusion is that Fibonacci retracement within the zones can be explained by statistical chance alone. This favors the myth argument.
All waves and corresponding corrections are provided in a downloadable Excel file. If you want use the data to do your own analysis please contact me.
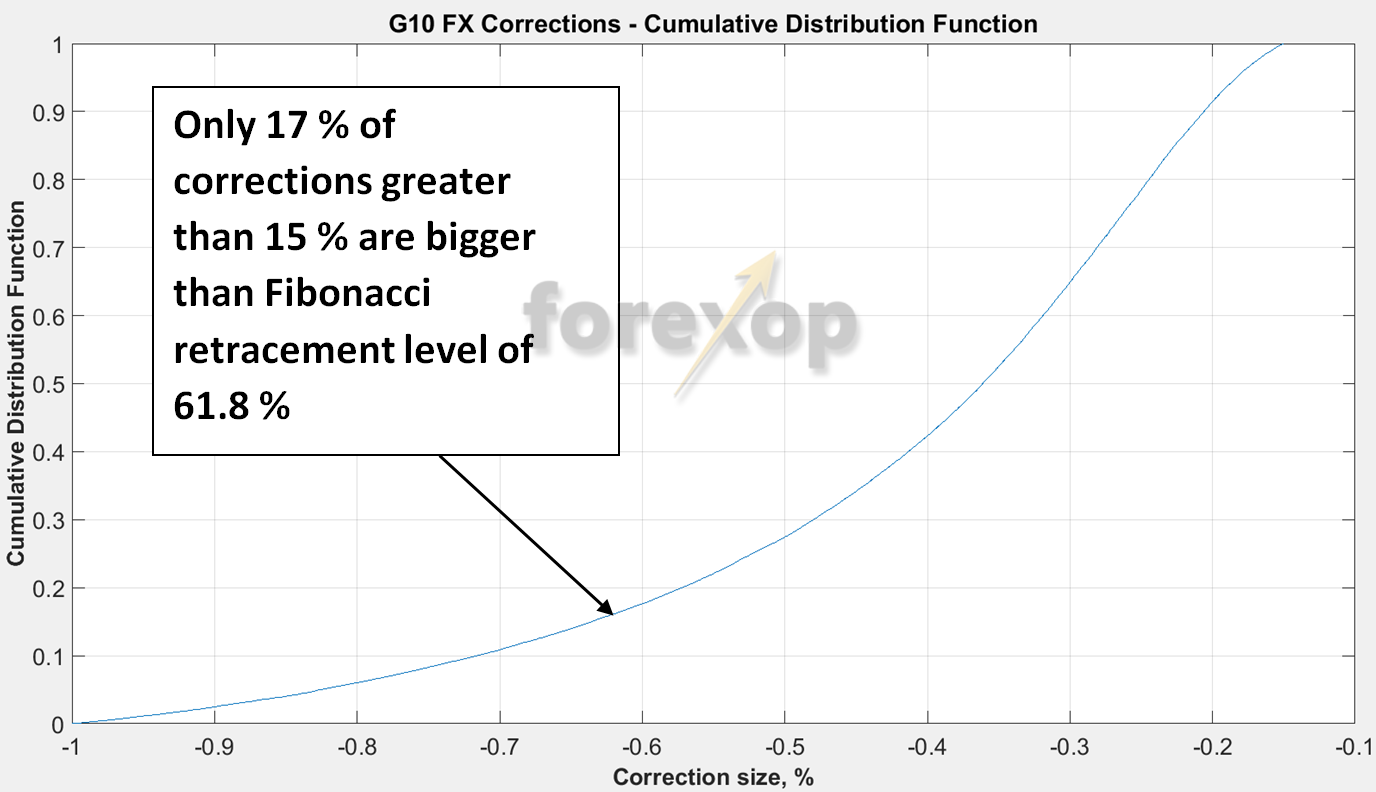
Figure 5 shows the cumulative distribution function of all corrections for G10 currency pairs with USD.
Figures 6 show the histograms for each currency pair.
In essense, what the G10 histograms show is that price action at the Fibonacci retracement levels is not significantly distinct compared to other nearby levels. Moreover the distributions are clearly log normal.
In other words, we don’t observe peaks or troughs around certain correction levels which would be true if Fibonacci reversals were indeed significantly distinct events.
There is only a 17 % chance (Figure 6) that the correction size will be greater than the 61.8 % Fibonacci level. This means that 83 % percent of 40,243 examined corrections are contained between the level of 15 % and 61.8%.
And because there are 4 Fibonacci levels in this region (23.6 %, 38.2 %, 50%, 61.8 %), there is a high probability that the correction will occur somewhere nearby one of Fibonacci levels. By chance alone!
My conclusion from this study is that Fibonacci retracement levels do not represent a real phenomenon. Rather, retracements within these zones can be explained by statistical chance alone.
With any charting technique, there’s a human tendency to look at the chart and “only see” cases where the rule holds. We ignore the multitude of cases where the rule doesn’t hold.
This I believe is what’s happening with Fibonacci. A trader sees the retracement occurring between the level or close to the level. Further, he/she may proceed to “line up” the indicator with these levels and conclude that the effect is indeed real when it isn’t. We’ve also found in other studies that even purely randomized price data can create the impression of these kinds of reversal lines.
I welcome comments on these findings and will be glad to hear your remarks on Fibonacci analysis and whether you find it useful or not.
| Pair | Value of 1 pips | Minimum Wave Size in pips | Minimum Correction size in pips |
| EURUSD | 0.0001 | 100 | 15 |
| GBPUSD | 0.0001 | 150 | 22.5 |
| USDJPY | 0.01 | 100 | 15 |
| USDCHF | 0.0001 | 100 | 15 |
| USDCAD | 0.0001 | 100 | 15 |
| AUDUSD | 0.0001 | 80 | 12 |
| NZDUSD | 0.0001 | 80 | 12 |
| USDSEK | 0.0001 | 800 | 120 |
| USDNOK | 0.0001 | 700 | 105 |


Scalping
Daily pips
Essential for anyone serious about making money by scalping. It shows by example how to scalp trends, retracements and candle patterns as well as how to manage risk. It shows how to avoid the mistakes that many new scalp traders fall into.
Fibonacci is gypsy!!!
Hi, thanks for sharing . May I ask how did you define a wave quantitatively ? For example, in Figure 3b, between X and Y there I can see multiple small waves but it’s excluded.
Is it possible to evaluate the reliability of Elliott waves using the same method?
Thank you for this thorough research.
The 50 percent line is not an actual fibonacci line as you said but it does seem to carry some weight as a support / resistance. I find that this is a valid indication only where there is major peak and trough on the chart. And even then the correction at the fibo-line is not always a full correction but often times just a temporary reversal back the other way. I see this for the other fib levels ( 23% 38% 63% ) as well. So it looks to me some are trading into it and some against it but overall the net effect is probably neutral. I agree as well there is a lot of psychological interpretation going and if these are just chance reversals that are happening anyway is for sure a possibility.
Thanks for this, very useful.
As Fiber said I’ve heard people say they don’t believe Fibonacci but other people do so therefore it can be useful in trading. It is 100% certain that algorithms and a lot of traders are trading these levels. But to trade against them for profit you have to find a way of frontrunning those trades. Then you think how many permutations of different levels you can create in choosing the start and end points for Fibonacci? And that’s at just at one time interval.
That means the problem of choosing a level among many alternatives and then successfully frontrunning it has a lot of complications I think that make it beyond feasible as a common strategy. Fibonacci is one of those things you can’t prove it or disprove it. But I like this analysis in that what it shows is the corrective waves lining up with some arbitrary ratios can be purely coincidental. And it probably is. As Occam’s razor says the simplest explanation is usually the right one.
Thank you CTA Trader.
I completely agree with you and that is why I tried to choose those waves, which will be maximally unambiguous. And because there are 40000 + waves in the discussed set, it should be a good representative sample I think.
I find Fibonacci tone a great tool to use simply because so many traders and institutions are using it.
I trade the Market Makers model and use Fibonacci with success as obviously they also use it to manipulate market and us traders moves.
Thanks for the indepth report.
Thanks. Good information.
Interesting research. Thank you.
I think even Fibonacci levels are not significant for reversals we still can use this data for planing reversals in range from 23% to 38%. Also we can use level 68% for placing stop loss.
What about research on indexes and commodities (CFD)? I heard argument why Fibonacci levels work well in futures markets because algorithms are trading these levels.
Is it possible to have this algorithm for making more tests?
Thank you very much Fiber.
I think yes, this results potentially can be used to identify optimal entry and stop loss levels when combined with other signals. The exact levels probably will depend from the number of input parameters including desired stop loss/take profit ratio and the confidence level the trader wants to obtain. For some values of input parameters, I will not exclude that Fibonacci levels can become the optimal solution.
I agree that it is a good idea to do the same test for futures. If we compare with FX, equity and commodity markets have longer history and most of the methods of classic tech analysis were initially used for these markets. Also will be interesting to compare obtained results across different asset classes.
I will try to do the test for those markets and maybe we will have another post for this topic in near future. If you have any ideas on how to do it (for example how to choose waves, time interval, incorporate dividends and spin-offs or not, and any idea you have) please let us know here so I will try to incorporate.