

Of the triangular patterns found in forex charts, the symmetrical triangle is possibly the most confusing and also the most difficult to trade.
In this post I’ll look at how useful this chart pattern is in practice as well as possible trade strategies.
Identifying a Symmetrical Triangle in Forex Charts
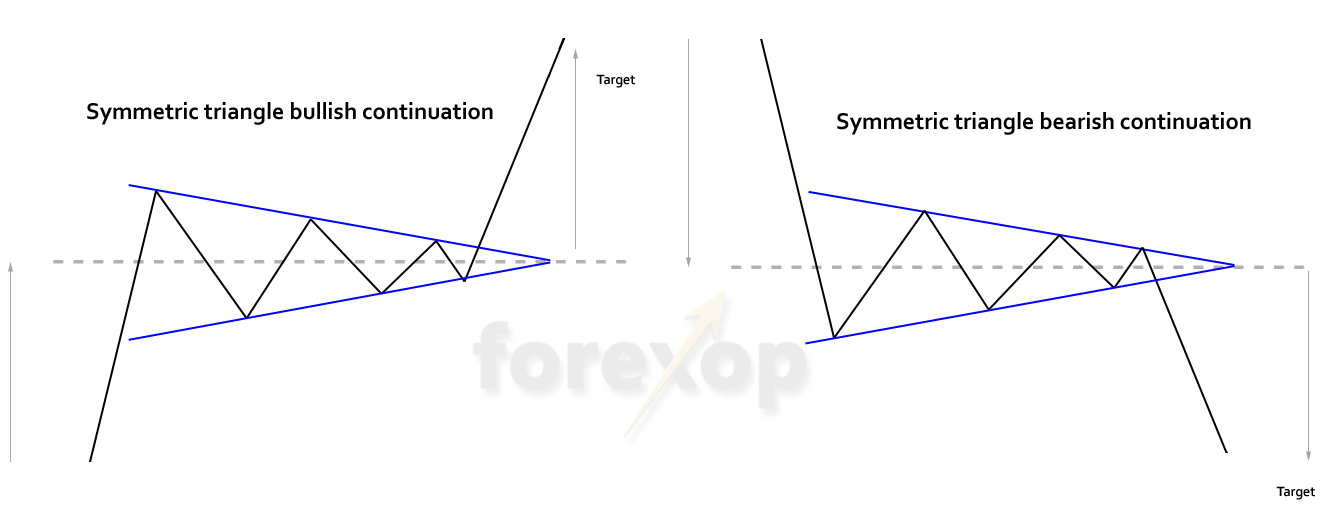
The symmetrical triangle occurs when there’s a rising support line meeting a falling resistance line. In other words, the peaks and troughs in price are getting smaller and closer together.
Unlike a descending or ascending triangle, the peaks are falling at the same rate as the troughs are rising. Therefore the market direction is more or less flat.
This consolidation causes a drop in volatility as the price narrows into the triangle’s tip.
The ascending and descending patterns have a flat top edge or flat bottom edge respectively. But the symmetric has a sloping upper and a lower edge which are the mirror image of one another.
As shown in the diagram above, the shape is similar to the pennant. The only difference is that there’s no need for a mast (flag pole). You’ll find the definitions do overlap a good deal in real charts.
In forex you can find these patterns at virtually any time scale. But they tend to be more reliable when developing over a longer periods (see data below). As a matter of definition, patterns over shorter time spans are considered pennants, rather than triangles. In both case the trading rule is the same.
Symmetric triangles are commonly found in:
- Trend tops
- Trend bottoms
- Inflection areas
Example of a Bearish Continuation
Figure 2 shows a triangle appearing at an inflection area during a long term down trend.

This triangle forms on a failed breakout attempt. If this bearish rally had had more strength it may have pushed higher and formed into a rising wedge. In this case, the momentum weakens while support remains firm at the lower support line of the pattern. Therefore the price forms a bearish symmetric triangle.
In this example, the price never broke the upper resistance line. There’s a clean downward break as it ends. There’s virtually no pullback.
How reliable is the Symmetrical Triangle?
To get an idea of this pattern’s reliability I’ve analyzed the charts of five currency pairs over a ten year period.
On the four hour chart (H4) there were a total of 165 symmetrical triangles. I measured the trend using the slope of the simple moving average line (SMA-100).
If the breakout after the triangle was up and the trend was up, this was classified as correct bullish. When the breakout was down, and the trend was down, this was classified as correct bearish. Patterns where there wasn’t a clear trend were ignored.
| Time | Pair | Correct bearish | Correct bullish |
| H4 | USDCAD | 61.5% | 57.1% |
| H4 | USDJPY | 33.3% | 40.0% |
| H4 | GBPUSD | 52.0% | 57.1% |
| H4 | EURUSD | 61.5% | 65.4% |
| H4 | USDCHF | 61.5% | 53.8% |
| Averages | 54.0% | 54.7% |
As the table shows, on the H4 chart the symmetrical triangle has a favorable history of success. The odds are about 54%. Bullish breakouts had slightly better odds with a success rate of 54.7%.
The results were slightly worse on the one hour chart (H1).
| Time | Pair | Correct bearish | Correct bullish |
| H1 | USDCAD | 49.3% | 58.6% |
| H1 | USDJPY | 59.7% | 59.6% |
| H1 | GBPUSD | 50.0% | 45.1% |
| H1 | EURUSD | 50.6% | 51.0% |
| H1 | USDCHF | 49.0% | 50.0% |
| Averages | 51.7% | 52.9% |
In this test, there was a total of 525 patterns on all charts over the period investigated. The pattern was correct in predicting a continuation in 52% of cases. Again the bullish pattern had slightly better odds of being correct.
Even though the numbers are quite small, this does give some objective data on the reliability of the symmetric triangle across forex pairs.
How to Trade a Symmetrical Triangle
As shown above, all things equal a symmetrical triangle hints towards a continuation in trend.
There’s often a powerful directional move as the “volatility squeeze” ends, so it can offer some good trade opportunities. But before placing a trade, it’s best to wait for a confirmation of the direction of the breakout.
When the pattern ends, the volatility dips to a minimum and the support and resistance lines will be very close. The market will then usually start to show some preferred direction. There’s no guarantee of this however. As always it’s best to prepare for false breaks and retests of the resistance & support lines.
Trade setup for continuation
The easiest way to trade this chart pattern is to treat it as a continuation breakout. Here just wait for a clear break above the resistance line in a bullish trend or wait for a clear break below the support line in a bearish trend.
To do this we use our support resistance indicator together with the triangle chart tool. Using the same settings you can have the indicator draw the support/resistance lines that extend from the pattern. The tool can also alert on a break of either the support or resistance line.
As with other triangular patterns, we place first stop losses and profit targets at a distance no greater than the triangle’s depth. We also trade these events using a split order entry system. This protects against breakout reversals which happen often.

In Figure 3 after the pattern ends, the price never breaks the upper resistance line. It simply tracks the resistance line downwards with the trend.
Trade setups for a bullish reversal
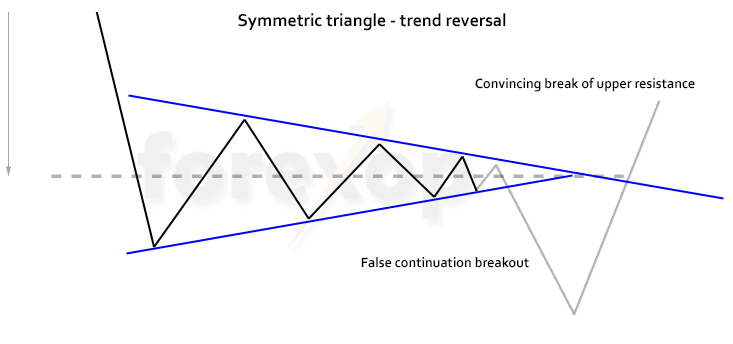
As I said above symmetrical triangles do form at trend tops/bottoms. These are reversals. These can be difficult trades in practice due to timing. And this pattern is not a strong signal of reversal. The market often flips in a directionless and volatile way well after the pattern completes. Usually enough to shake out stop losses.
To trade a bearish to bullish reversal, I find it’s best to wait for some signal that the top edge of the pattern – the main resistance line has failed in a convincing way. Sometimes this can happen a while after the pattern ends. It can be worth the wait though because these events often mark the start of a new bull trend.
Once the likely breakout direction is clear, we place the orders with a split entry method. This way losses are limited if the breakout does reverse back on itself.
For a bullish to bearish reversal just do the opposite of the above.
Conclusion
At first glance, symmetrical triangles don’t seem to offer much forecasting ability. This pattern has slightly better than even odds at predicting a trend continuation. Therefore the easiest way to trade these is as a continuation breakout.
Spotting the trend reversal cases is a bit more tricky. Yet these can offer higher profit potential because they can mean the start of a new bull or bear trend.
More on the triangle/wedge indicator

Ebook Pack
3x Popular eBooks
eBook value set for the classic trading strategies: Grid trading, scalping and carry trading. All ebooks contain worked examples with clear explanations. Learn to avoid the pitfalls that most new traders fall into.
Is there anything different when you use a higher vs. a lower time frame? I mean do you use the same basic approach in 15 minute to daily chart or is it the same idea? I want to try on 5-minute chart to start as you say there are more patterns to trade from than in the daily chart or longer.
It’s basically the same approach. Obviously though the stop and profit target need to be wider when trading on a higher time frame. You’ll also need to factor in the holding costs (swap fees) of whichever instrument you are trading for longer periods.
Thanks. I use the triangle as a break out because they do work out in my experience. The thing is that you have to keep careful watch on the S/R and if it goes against you be ready to pull out quick.