
Most traders spend their time on entries: which pattern, which indicator, which timeframe. Position sizing gets a few seconds at the end, and the lot size is often the same as last time. But the lot size decides what a trade actually does to your account. The same entry on the same chart can cost you 0.5% or 10%, depending only on how big the position is.
Position sizing turns a trade idea into a number of lots. You start with the amount you are prepared to lose if the trade fails. You then work backwards from the stop loss to the position size that loses exactly that amount.

What Is Position Sizing?
Position sizing means choosing how many lots (or units) to trade, so that a loss at your stop is a fixed, planned amount. It answers one question: how much of my account am I putting at risk on this trade?
It is the core of money management, and it does three jobs:
- It keeps losses survivable. Every strategy has losing streaks. Small, consistent risk means a bad run costs you a few percent, not your account.
- It makes trades comparable. A 30-pip stop on EUR/GBP and a 250-pip stop on GBP/JPY can carry exactly the same risk in dollars.
- It separates the trade from your emotions. When the loss is decided before you enter, there’s less temptation to move the stop or “give it a bit more room”.
It doesn’t turn a losing strategy into a winning one. What it does is decide how long you can keep going while you find out which one you have.
Lots, Units and Pips
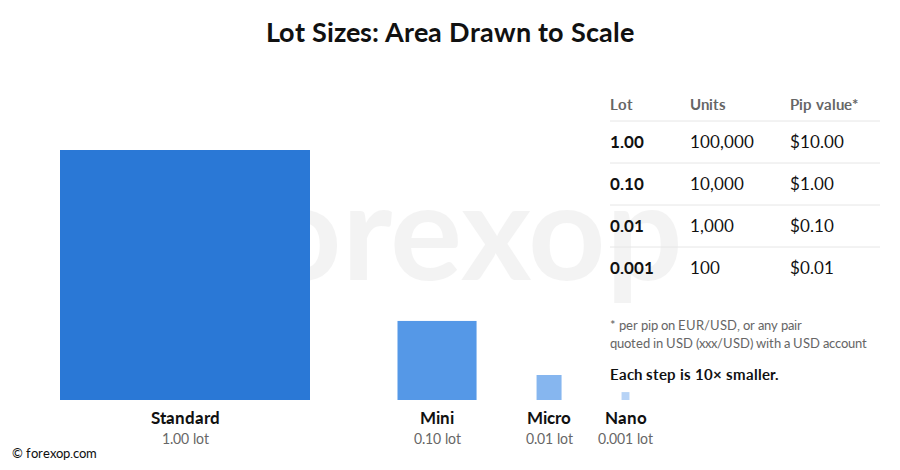
Forex positions are measured in lots. A standard lot is 100,000 units of the base currency, the first currency in the pair. Buying 1 lot of EUR/USD means buying €100,000. Most brokers let you trade fractions of a lot, down to 0.01 (a micro lot) and sometimes 0.001 (a nano lot).

A pip is the standard unit of price movement: 0.0001 for most pairs and 0.01 for pairs quoted in Japanese yen. The pip value is how much money one pip is worth for a given position size. For any pair where the US dollar is the second currency (EUR/USD, GBP/USD, AUD/USD, NZD/USD), one pip on one standard lot is always worth $10.
| Lot size | Name | Units | Pip value on EUR/USD |
|---|---|---|---|
| 1.00 | Standard | 100,000 | $10.00 |
| 0.10 | Mini | 10,000 | $1.00 |
| 0.01 | Micro | 1,000 | $0.10 |
| 0.001 | Nano | 100 | $0.01 |
Those are the only three numbers you need: the lot size, the stop distance in pips, and the pip value. Multiply them together and you have the amount at risk.
The Position Sizing Formula
The formula works backwards from the amount you’re willing to lose:
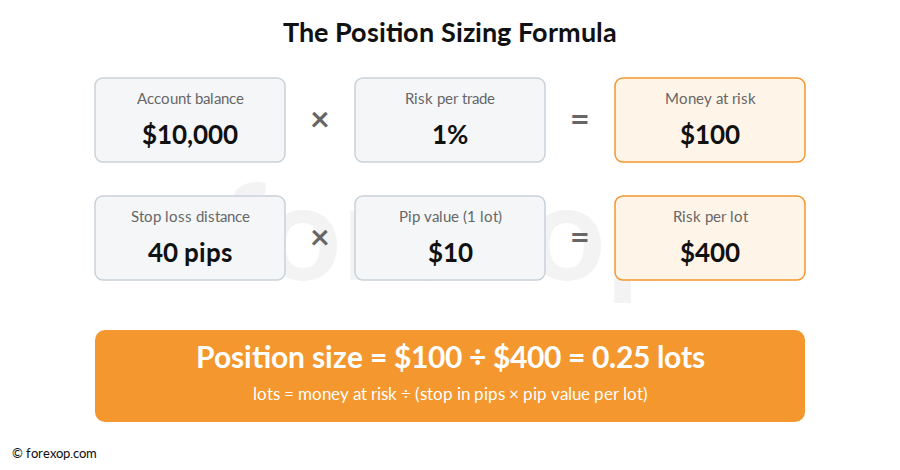
Lots = Money at risk ÷ (Stop loss in pips × Pip value per lot)
In three steps:
- Money at risk = account balance × risk per trade. With $10,000 and 1% risk, that’s $100.
- Risk per lot = stop loss in pips × pip value for 1 lot. A 40-pip stop on EUR/USD is 40 × $10 = $400 per lot.
- Position size = money at risk ÷ risk per lot. $100 ÷ $400 = 0.25 lots.
Check the answer by running it forwards: 0.25 lots is worth $2.50 a pip, and 40 pips × $2.50 is $100. If the stop is hit, you lose 1% of the account.
Always round down. Brokers only accept lot sizes in fixed steps, usually 0.01. If the formula gives 0.257 lots, trade 0.25, not 0.26. Rounding up means risking more than you planned on every trade.
If you’d rather not do the sums by hand, our position size calculator does the same calculation with live prices, for 28 currency pairs plus gold and oil, in eight account currencies.
Why the stop decides the size
The formula has a consequence that surprises many new traders: the wider the stop, the smaller the position. The money at risk stays the same. Only the lot size changes.
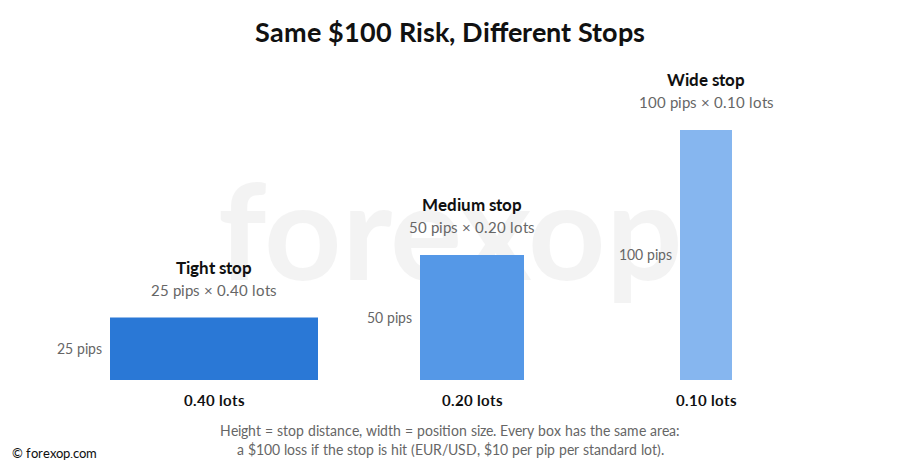

This is why “how many lots should I trade?” has no fixed answer. A trader with a 15-pip scalping stop and a swing trader with a 150-pip stop can risk exactly the same $100. The scalper trades ten times the size.
Worked Example: AUD/USD Breakout (2025-26)
Here is a real trade from the study later in this guide. On 28 November 2025, AUD/USD closed at 0.6548, above its highest close of the previous 20 days. The rules said: buy at the next open, with a stop 2 × the average true range (ATR) below the entry.
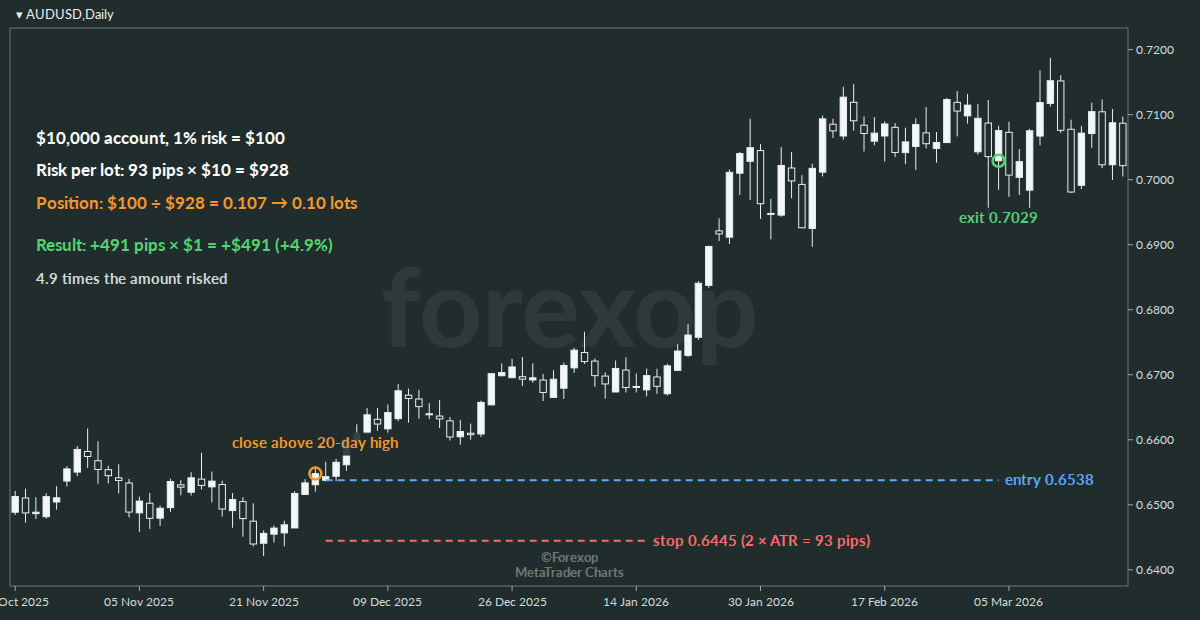

- Entry: 0.6538, at the open on 1 December 2025.
- Stop: the 20-day ATR was 46 pips, so the stop went 93 pips below the entry, at 0.6445.
- Money at risk: $10,000 × 1% = $100.
- Risk per lot: 93 pips × $10 = $928 (using the exact 92.8 pips).
- Position size: $100 ÷ $928 = 0.107, rounded down to 0.10 lots, or $1 per pip.
The trend carried on for three months. The trade was closed at 0.7029 on 4 March 2026 when the price closed below its 10-day low. That’s a gain of 491 pips, or $491 before costs: about 4.9% of the account, for a trade that only ever risked 0.93%.
That’s what good position sizing looks like in practice. The loss was capped in advance, and the profit was left to run.
Pip Values for Other Pairs
The $10-per-lot rule only works when the pair is quoted in your account currency. For every other pair, the pip value has to be converted.
A pip is always worth 10 units of the quote currency (the second currency) per standard lot, or 1,000 units for yen pairs. To get it in your account currency, convert at the current exchange rate:
- USD/JPY (USD account): a pip is ¥1,000 per lot. At 157.29, that’s 1,000 ÷ 157.29 = $6.36.
- USD/CHF: CHF 10 per lot ÷ 0.8286 = $12.07.
- EUR/GBP: £10 per lot × 1.3246 (GBP/USD) = $13.25.
- EUR/USD with a euro account: $10 per lot ÷ 1.1394 = €8.78.
Here are the pip values for a US dollar account at the closing prices on 25 September 2026. They change as exchange rates move, so pairs like USD/JPY and USD/CHF need to be recalculated from time to time.
| Pair | Pip size | Pip value, 1 lot | Pip value, 0.01 lot |
|---|---|---|---|
| EUR/USD, GBP/USD, AUD/USD, NZD/USD | 0.0001 | $10.00 | $0.10 |
| USD/JPY, EUR/JPY, GBP/JPY | 0.01 | $6.36 | $0.064 |
| USD/CAD | 0.0001 | $7.07 | $0.071 |
| USD/CHF | 0.0001 | $12.07 | $0.121 |
| EUR/GBP | 0.0001 | $13.25 | $0.132 |
The pip value calculator works this out for any pair and account currency using live rates.
Gold, Oil and Other Markets
The same formula works for any market. The only thing that changes is the contract size, and that varies between brokers, so check yours. The most common settings are:
- Gold (XAU/USD): 1 lot = 100 ounces, so each $1 move in gold is worth $100 per lot.
- WTI crude oil: 1 lot = 1,000 barrels, so each $1 move is worth $1,000 per lot.
Say you want to buy gold with a $15 stop, risking $100. The risk per lot is $15 × $100 = $1,500, so the position is $100 ÷ $1,500 = 0.066, rounded down to 0.06 lots.
It helps to know how much a normal day’s move is worth before you trade something new. Figure 5 shows the average daily range (14-day ATR) on one standard lot for each market.
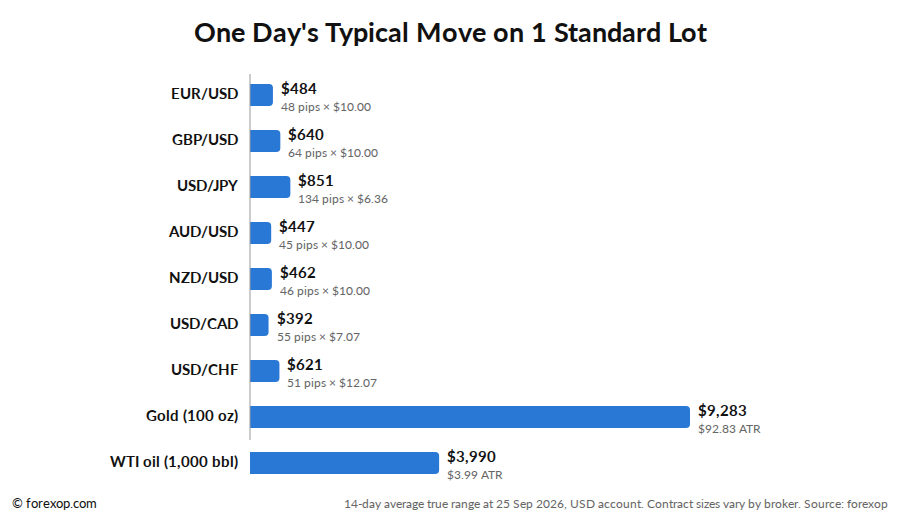

A trader used to 1 lot of EUR/USD, where a typical day is worth about $480, who then trades 1 lot of gold is taking on almost 20 times as much daily risk. Fixed lot sizes across markets are one of the quickest ways to blow up an account.
Set the Stop First, Then Size the Trade
The order matters. Many traders pick a lot size first, then set a stop that keeps the loss “reasonable”. That gets it backwards. The stop should go where the trade idea is proven wrong, based on the chart. The position size is then whatever fits that stop.
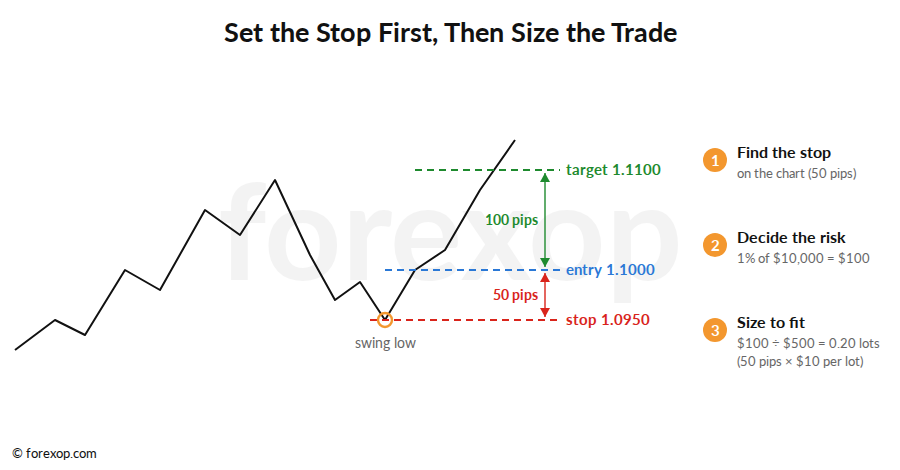

Good places for a stop are beyond a swing high or low, beyond a pattern (for example above the right shoulder of a head and shoulders), or a multiple of the average true range. An ATR stop has a useful side effect for position sizing. When the market gets more volatile, the stop widens and the position automatically shrinks. This is called volatility-adjusted position sizing, and it’s how most professional trend followers work.
A stop set too tight to allow a bigger position is a false saving. It just gets hit more often. If the right stop makes the position smaller than you’d like, the answer is to trade smaller or skip the trade. If you’re not sure where your stop and target should go, our Stop Loss Take Profit indicator for MetaTrader calculates the levels and estimates the chance of a trade ending in profit or loss.
When the Stop Doesn’t Hold
Position sizing assumes you get out at your stop. Usually you do, give or take a pip or two of slippage. But a stop loss is an order to close at the next available price. If the market jumps over your level, you get filled wherever it reopens.
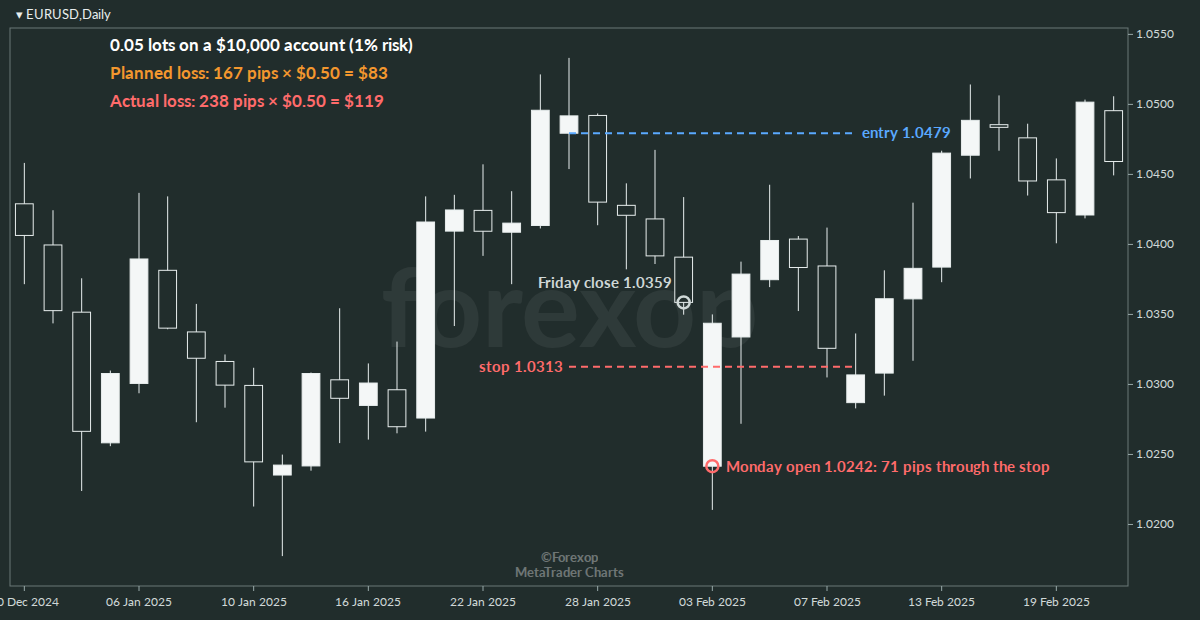

This happened to one of the trades in our study. EUR/USD was bought at 1.0479 on 27 January 2025, with a stop at 1.0313. On Friday 31 January it closed at 1.0359, 46 pips above the stop. Over the weekend, the US announced new tariffs, and on Monday the market opened at 1.0242, 71 pips through the stop. On a $10,000 account at 1% risk, the planned loss was $83. The actual loss was $119, 1.43 times the plan.
Gaps like this are one reason not to risk too much on any one trade. At 1% risk, a gap that costs 1.4 times the plan is annoying. At 10% risk, the same gap wipes out 14% of the account in one go. Weekends, central bank decisions and currency interventions (like Japan’s in USD/JPY) are the usual culprits.
How Much Should You Risk per Trade?
The most common rule is to risk 1% to 2% of the account per trade. The reason is losing streaks. They happen to every strategy, and they’re longer than most people expect.
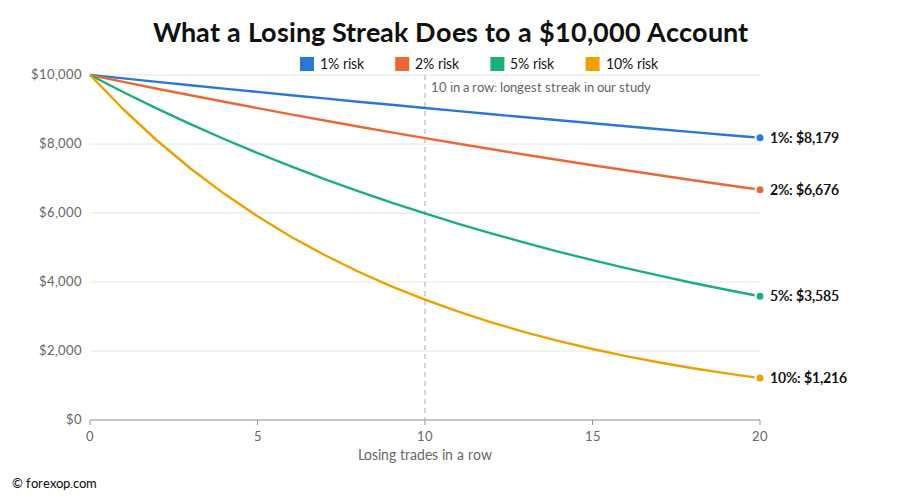

Our study, covered in the next section, had 10 losing trades in a row. That isn’t unusual. For a strategy that wins 40% of the time, a run of 8 or more losses somewhere in 200 trades is more likely than not. At 1% risk, ten straight losses cost about 10% of the account. At 5% they cost 40%, and at 10% they cost 65%.
The damage is worse than it looks, because losses and gains aren’t symmetrical. After a 50% drawdown, you need to double the account just to get back to where you started.
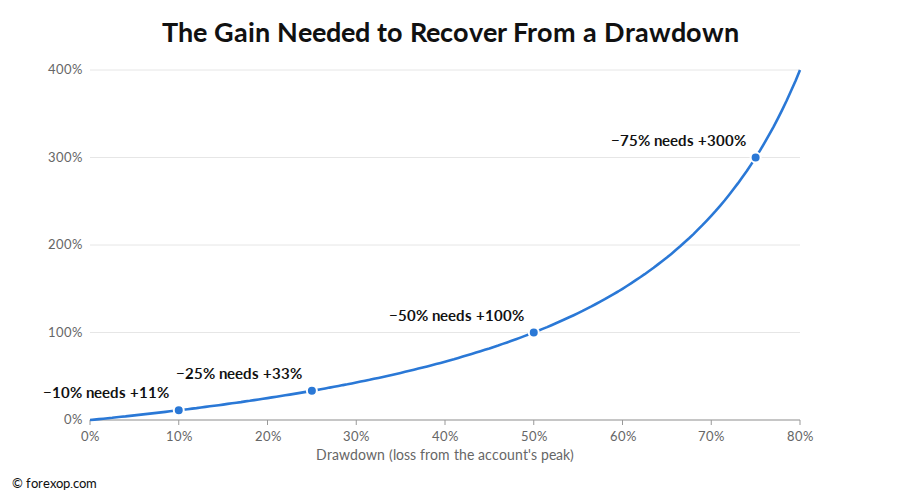

For more on getting through a losing run, see drawdown: exit strategies and avoiding common mistakes.
As a rough guide:
- 0.5% or less: sensible when you’re testing a new strategy, trading large accounts, or on a prop firm challenge with tight drawdown limits.
- 1%: the usual default. It survives long losing streaks with room to spare.
- 2%: the upper end of normal, for a strategy with a proven record.
- 5% and above: aggressive. A normal losing streak can cut the account in half.
Our Study: the Same 321 Trades, Sized Five Ways
To see what position sizing does in practice, we took one simple strategy and ran exactly the same trades at different sizes.
The rules: a classic 20-day breakout, similar to the Turtle trading system, on the seven USD major pairs, using daily prices from December 2022 to September 2026. Buy (or sell) at the open after a close above the highest close (or below the lowest close) of the past 20 days. The stop is 2 × the 20-day ATR. Exit at the next open after a close beyond the 10-day low (or high). Every trade pays 1 pip in costs. The account starts at $10,000, and lot sizes are rounded down to 0.01 lots.
The strategy produced 321 trades. 39% were winners. The average winner made 0.95 times the amount risked, and the average loser lost 0.73 times. That adds up to a small loss of 0.08R per trade. Breakout strategies had a hard few years in these markets. That makes it a useful test: it shows what position sizing does when a strategy goes through a bad patch, which every strategy eventually does.
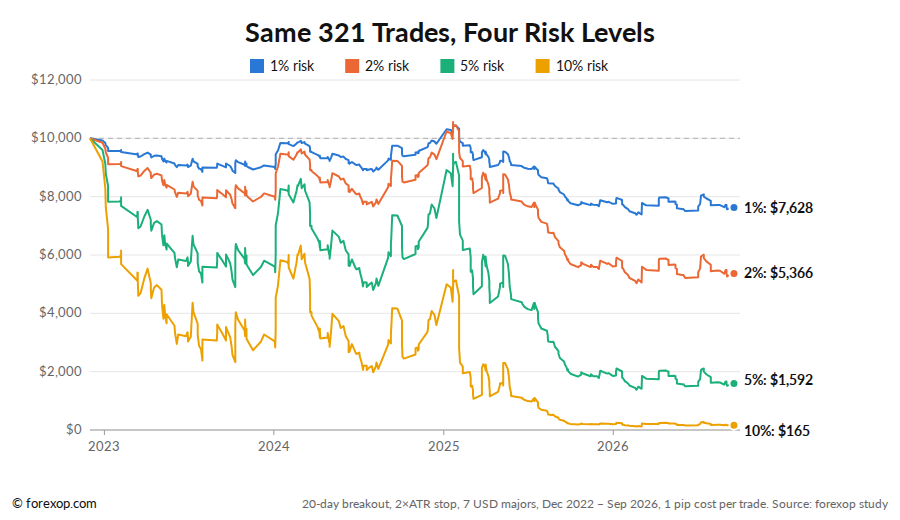

| Sizing | Final balance | Return | Worst drawdown | Gain needed to recover |
|---|---|---|---|---|
| Fixed 0.07 lots | $7,613 | −23.9% | −31.3% | +31% |
| 1% per trade | $7,628 | −23.7% | −29.6% | +31% |
| 2% per trade | $5,366 | −46.3% | −52.3% | +86% |
| 5% per trade | $1,592 | −84.1% | −86.2% | +528% |
| 10% per trade | $165 | −98.3% | −98.8% | +5,956% |
The trades were identical. Only the size changed. At 1% risk, the account ended down 24%. That’s painful, but it’s still a working account. You could fix the strategy, or switch to a better one, and carry on. At 5% risk, the same trades lost 84%, and getting back to $10,000 would take a 528% gain. At 10%, the account was finished: by the end it was too small to open even a 0.01 lot position on some pairs without going over the risk limit.
High risk also makes the good runs look spectacular. By 21 January 2025, after a strong run of winners, the 5% account had climbed back to about $9,500, and the 10% account had more than doubled from its low to almost $5,500. That’s exactly what makes high risk tempting. Both gave it all back, and more.
Fixed lots vs fixed percent
We also ran the trades with a fixed 0.07 lots, chosen so the average risk per trade was about 1% of the starting balance. The final result was almost the same as the 1% account. The difference was what each trade put at stake.
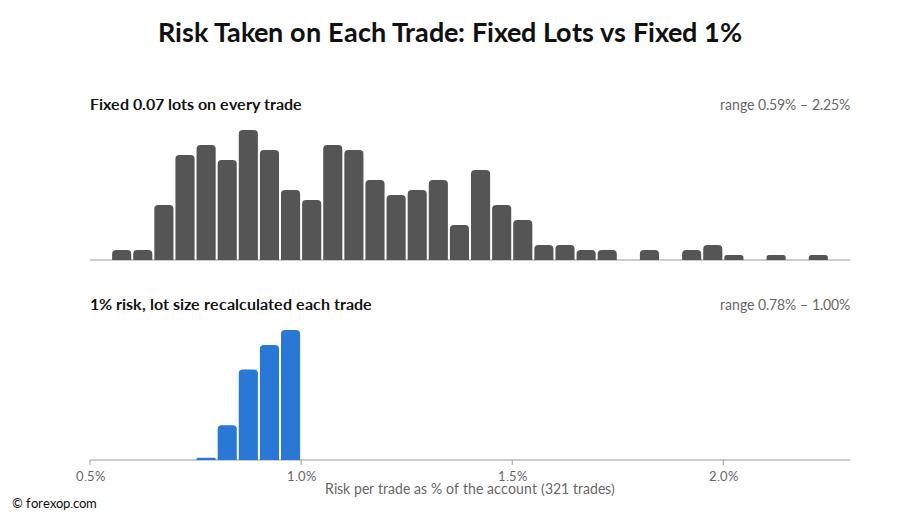

With fixed lots, the risk on each trade ranged from 0.59% to 2.25%, almost four times as much on some trades as on others. That happened because the stops ranged from 85 pips to over 400, and the pip value was different for each pair. With fixed-percent sizing, every trade risked between 0.78% and 1.00%. (The small spread comes from rounding down to 0.01 lots.)
The spread in fixed-lot risk also means the results depend on luck. If the biggest losses happen to land on the trades with the widest stops, the fixed-lot account takes a much bigger hit. The fixed-percent account also shrinks its positions as it loses and grows them as it wins, which is one reason it lost slightly less.
Open Risk and Correlated Trades
“1% per trade” is not the same as “1% at risk”. If you have five trades open, each risking 1%, you have 5% at risk. And if those trades all depend on the same thing, they can all be stopped out together.
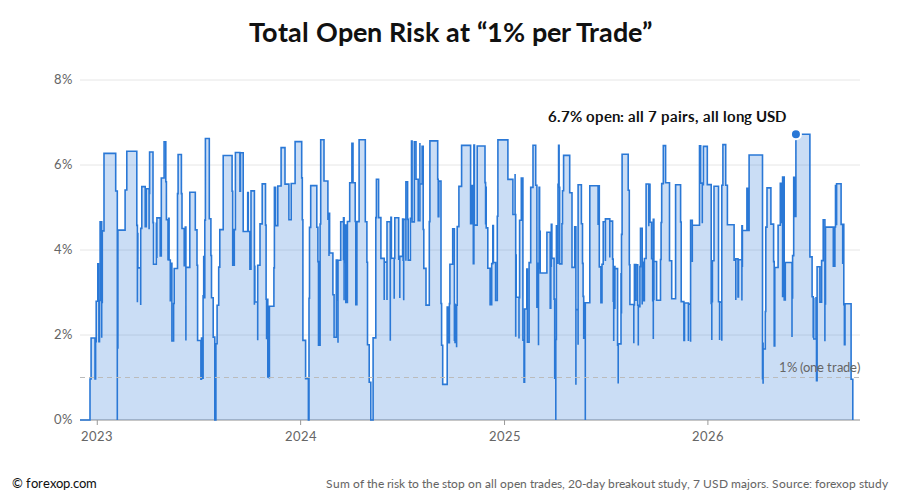

In our study, the median amount at risk across all open trades was 4.6% of the account, not 1%. On 8 June 2026, all seven pairs had open trades at once, and every one of them was a bet on a stronger US dollar. On paper, those were seven trades risking 1% each. In reality, they were one 6.7% bet on the dollar. In January 2023 the same thing happened the other way: seven trades, all short the dollar, with 6.3% at risk.
This is why many traders cap their total open risk (often called portfolio heat) at something like 4% to 6%. They also treat highly correlated trades as a single position. If EUR/USD and GBP/USD are moving together, buying both at 1% each is much closer to one trade at 2%. The forex correlation matrix shows which pairs are currently moving together.
To keep track of your total risk in MetaTrader, our free Forex Risk Calculator shows how much of your account is at risk across all open positions, and which ones could lose the most. Metatrader Money Management goes a step further, with an overall risk score based on all your holdings, your account size and market conditions.
The Kelly Criterion
The Kelly criterion is a formula for the bet size that grows an account fastest, given the win rate and payoff of a strategy:
Kelly % = W − (1 − W) ÷ R
where W is the win rate and R is the average win divided by the average loss. For a strategy that wins 40% of the time, with winners twice the size of losers, Kelly is 0.40 − 0.60 ÷ 2 = 0.10, or 10% of the account per trade.
We tested that with 10,000 simulated runs of 200 trades each, using this hypothetical strategy. It has a solid edge: on average, it makes 0.2 times the amount risked per trade.
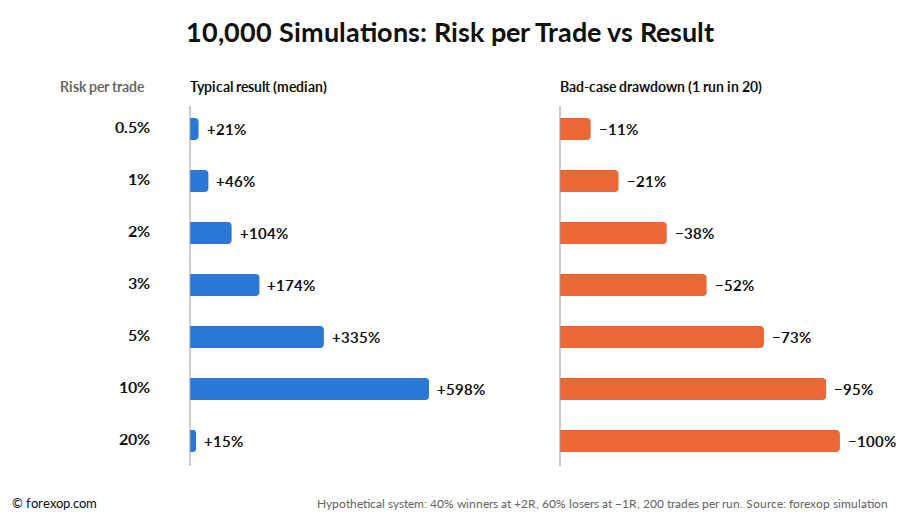

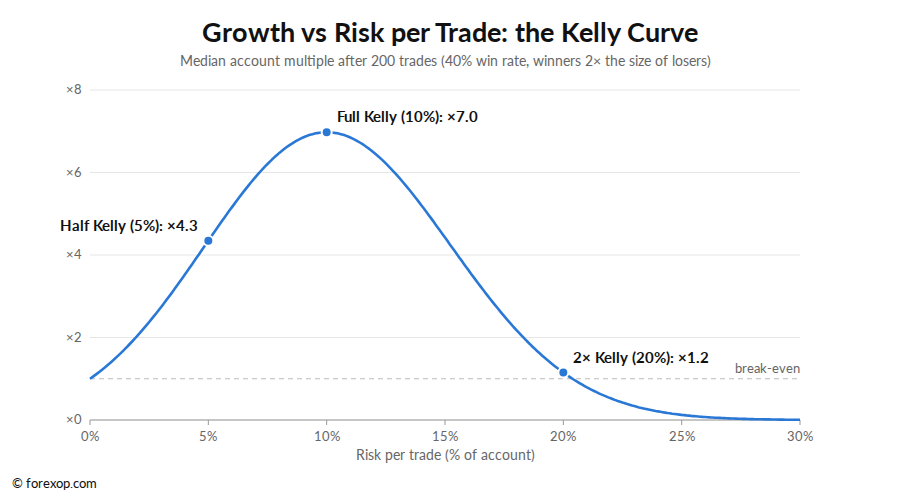

Full Kelly did produce the biggest typical return: the median account grew about seven times. But the ride was brutal. The median run had a 79% drawdown along the way, and 1 run in 20 fell by 95% or more. Risk more than Kelly and the returns go down, even though the edge hasn’t changed. At twice Kelly (20%), the median account barely grew at all, and almost half the runs lost money.
That’s why practitioners who use Kelly usually trade a fraction of it: half Kelly or less. Half Kelly gave about three quarters of the growth rate (a ×4.3 median) with a smaller drawdown, though a median of 50% is still far more than most traders could sit through. There’s a bigger problem too. Kelly needs you to know your true win rate and payoff, and you never do. It’s based on past results, and if they overstate the edge, Kelly will size you straight into the “too much risk” side of the curve.
For our breakout strategy, which had a negative edge, the Kelly formula gives a negative number. That’s Kelly’s way of saying: don’t trade this at all.
At 1% to 2% risk, the simulated strategy had very little chance of a 50% drawdown. It still doubled the account in the typical 2% run. For most traders, that’s a far better trade-off than chasing the peak of the curve.
Other Position Sizing Methods
Fixed-percent risk is the standard, but it isn’t the only approach:
- Fixed lots: the same lot size every trade. It’s simple, but risk varies with the stop distance and the pair, as the study showed. It’s only reasonable if your stops are always about the same size in the same market.
- Fixed dollar amount: risk the same $100 on every trade, whatever the balance. This is like fixed percent, but it doesn’t scale down after losses.
- Volatility-based: size so that each position has the same exposure to the market’s normal daily range (for example 1% of the account per 1 ATR). With an ATR stop, this ends up very close to fixed-percent risk.
- Fixed ratio: add one unit of size for every fixed amount of profit. It grows more slowly than fixed percent at first.
- Anti-martingale: increase size after wins and cut it after losses. Fixed-percent sizing already does this gently. See the anti-martingale system.
- Martingale: doubling up after losses. It feels safe until the losing streak that ends the account. See why the martingale is so dangerous. If you still want to use it, learn how to control the risk first: our Martingale Inside Out ebook explains how the system works and how to tame it.
Common Mistakes
- Confusing leverage with risk. Leverage sets how much margin a trade needs. It doesn’t set how much you lose. 0.20 lots of EUR/USD with a 50-pip stop risks $100 whether your leverage is 30:1 or 500:1. What high leverage does is let you open positions far too big for your account. See how to use leverage safely.
- Using the same lot size for every market. One lot of gold moves nearly 20 times as much money in a day as one lot of EUR/USD.
- Setting the stop to fit the lot size. Put the stop where it belongs on the chart, then size the position.
- Rounding up. Always round the lot size down.
- Forgetting the pip value conversion. A pip on USD/CHF is worth more than $12 per lot at current prices, not $10.
- Ignoring correlated positions. Five dollar trades at 1% each are a 5% bet on the dollar.
- Moving the stop further away. This quietly increases the risk on a trade that is already going wrong.
- Raising the risk after a losing run to “win it back”. This is how a normal drawdown becomes a margin call. See the dangers of the margin call.
Position Sizing FAQ
How do I calculate lot size in forex?
Divide the amount you want to risk by the stop loss in pips times the pip value per lot. For example, $100 ÷ (50 pips × $10) = 0.20 lots. Round down to your broker’s lot step.
How much is 1 pip on 0.01 lots?
On EUR/USD, GBP/USD and other pairs quoted in US dollars, 1 pip on 0.01 lots is $0.10 for a USD account. On USD/JPY it’s about $0.064 at current rates, and on USD/CHF about $0.12.
What lot size should I use for a $10,000 account?
It depends on your stop, not just the balance. At 1% risk ($100), a 25-pip stop on EUR/USD gives 0.40 lots, a 50-pip stop gives 0.20 lots and a 100-pip stop gives 0.10 lots.
What lot size should I use for a $100 account?
1% of $100 is $1. Even a 0.01 lot of EUR/USD with a 20-pip stop risks $2, which is 2%. Small accounts often need nano lots or a cent account to keep risk near 1%. Otherwise, they need tight stops.
Does leverage change my position size?
No. Your position size comes from your risk and your stop. Leverage only decides whether you have enough margin to open the position. You can check the margin with the margin calculator.
How do I calculate position size for gold?
Use the same formula with gold’s contract size. Most brokers use 100 ounces per lot, so a $1 move is worth $100 per lot. Risking $100 with a $15 stop gives $100 ÷ $1,500 = 0.06 lots (rounded down).
Is the 1% rule too cautious?
For most traders, no. In our 321-trade study, 1% risk left a working account after four difficult years. 5% risk lost 84%. If your strategy has a proven edge, 2% is a reasonable upper limit.
For more on managing risk, see 7 ways to lower risk in forex trading and value at risk. To see what a trade will make or lose at the target and stop before you place it, try the profit calculator.
Martingale
Complete Course
A complete course for anyone using a Martingale system or planning on building their own trading strategy from scratch. It's written from a trader's perspective with explanation by example. Our strategies are used by some of the top signal providers and traders