
Most traders are familiar with the classic Fibonacci indicator. This technical indicator is often used to define lines of retracement or extension. In technical analysis there are several other uses of Fibonacci and in this article I’ll cover what’s called the Fibonacci fan indicator.
What is Fibonacci Fan?
Fibonacci fan is primarily a tool for analysing trends. The most basic use of Fibonacci fan (or just fibo fan) is to mark out lines of support and resistance within a trend channel. To set up the indicator you simply mark two points on a forming trend.
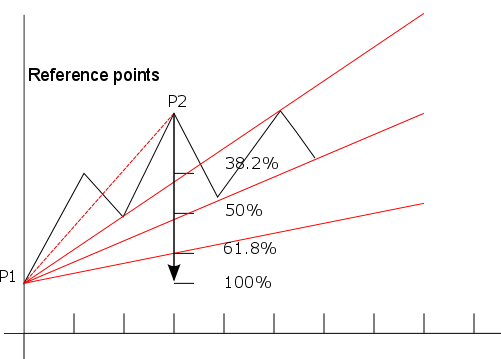
Fan lines drawn by the indicator then show “zones” where support or resistance is likely to occur. The two points that define the indicator position are chosen to be significant peaks and troughs in the chart section being examined. Figure 1 shows the basic setup.
A Rising Trend
In a rising trend, the first point of the fibo fan should mark the most significant recent low point in the chart section being analyzed. The second point should mark one of the first significant peaks in the lifting trend. The second point is usually placed no more than half way between the first point and the last point (most recent bar) in the chart.
The extension lines
After marking the two end points, the indicator will automatically calculate extension lines below the line that connects the two reference points. These are marked as 38.2%, 50%, and 61.8%. These are the familiar Fibonacci ratios.
The extension lines in the fan are markers for support and resistance. In the example of the rising trend, the extension lines will normally provide support when the price is above the line and resistance when below.
A Falling Trend
When the prevailing trend is downwards, the procedure above is done in reverse. The first point marks a significant high and the second point marks a significant low at the start of the trend. The fan lines that extend above the connecting line then mark areas of resistance and support.

Choosing the Marker Points
Choosing correct marker points is essential. The two reference points are normally chosen as extreme chart levels. The further the distance between the two marker points, the further out the extension lines of the fan will spread. If you choose a point too far out this won’t allow you enough observations to confirm that the price is indeed reacting around the extensions lines. On the other hand choosing points that are too close will mean that the angle of the fan will be too steep and the extension lines will not have any practical use.
The other thing to note is that because of the properties of the fan, the further out the lines extend (in time) the more sensitive they are to exact placement of the two marker points. This means a small change in placement of either of the marker points can result in large movements further out in the extension lines. The fan usually becomes less accurate the further out it extends.
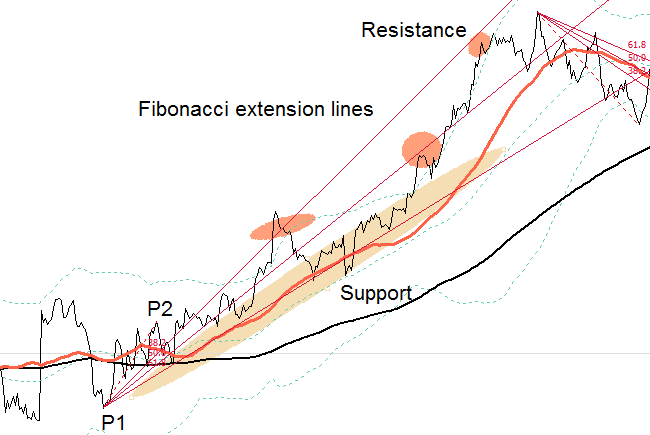
For this reason after creating the “primary fan” chartists often create a number of secondary fans that are defined between various peaks and troughs in the section being analyzed. This helps to give a more complete picture of the likely areas of price reversals.
In particular, the cross section of fans can predict the price behaviour within a smaller section of the chart (see Figure 2). When the price is no longer responding to the support or resistance areas of the first fan, it is disregarded (this can happen when it extends outside of the active chart area). For example, see Figure 1 which shows a secondary fan in the top section.
Trading on Fibo Fan
The most effective use of Fibo fan in Forex is when a major new trend is forming. This generally starts with a sudden and significant price reversal. The indicator has the most predictive value in these situations.
The first wave in a reversal is generally the strongest. This wave is then followed by a number of successive waves of falling momentum (see Elliott waves). The peaks and troughs of these waves often correspond with the extension lines in the Fibonacci fan.
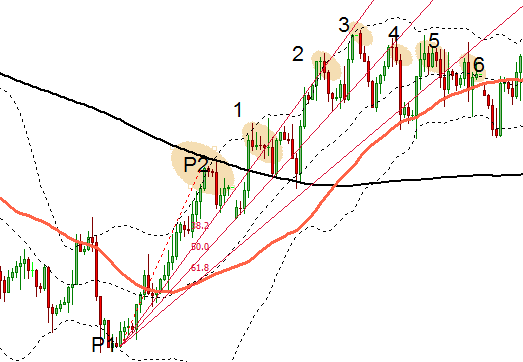
In other words as the momentum in a new rally subsides, the price peaks (troughs) made will start making lower highs and falling within the lower lines of the fan. This is shown in Figure 4. Peak 1 lies on the 23.6% extension line (not shown on most indicators). Peaks 2 and 3 fall at the 38.2 extension line. Peak 4 lies at the 50% line. Points 5 and 6 lie between the 50% and 61.8% lines but at this point a new trend starts to form and this fan loses its predictive use.
As with most indicators, the extension lines of fibo fan provide zones where price reversals are likely to occur. There are no certainties that the price will obey these areas of support or resistance, as shown in the chart above.
Relationship between Fan and Fibonacci Retracement Lines

Figure 5 above shows the relationship between fibo fan and classic Fibonacci retracement. If we draw a vertical line at P2, the second marker of the fibo fan, we see the levels intersect at the corresponding levels of the Fibonacci retracement grid. So the 50 percent retracement line on the horizontal grid intersects with the 50 percent fan line and so on.

Grid Trading
Definitive Guide
This ebook is a must read for anyone using a grid trading strategy or who's planning to do so. Grid trading is a powerful trading methodology but it's full of traps for the unwary. This new edition includes brand new exclusive material and case studies with real examples.