
The Gann Signal System combines Square of Nine mathematics with modern price action trading
William Delbert Gann (1878-1955) was a legendary trader who reportedly made over $50 million from the markets during his lifetime. His methods, while controversial, have fascinated traders for over a century. Gann believed that market movements follow mathematical laws based on time cycles, geometric angles, and natural phenomena.
Among his many techniques, the Square of Nine (also called the Square Root Calculator) stands as one of his most powerful tools for predicting price levels. This guide will demystify Gann’s square root theory and show you how to apply it practically in modern trading.
In This Article:
Who Was W.D. Gann?
Born in Lufkin, Texas, Gann began trading at age 24 and quickly developed a reputation for extraordinary market predictions. He combined his interest in ancient mathematics, astronomy, and geometry to create unique forecasting methods that he claimed could predict exact price targets and timing.
Gann was heavily influenced by ancient knowledge, particularly:
- The Great Pyramid of Giza – whose dimensions encode mathematical constants
- Biblical numerology – cycles of 7, 12, and 40
- Pythagorean mathematics – the sacred geometry of numbers
- Astronomical cycles – planetary movements and their market correlations
“There is a definite relationship between price and time… When you know the relationship between price and time, you know how to trade the markets.”
— W.D. Gann
Core Gann Concepts
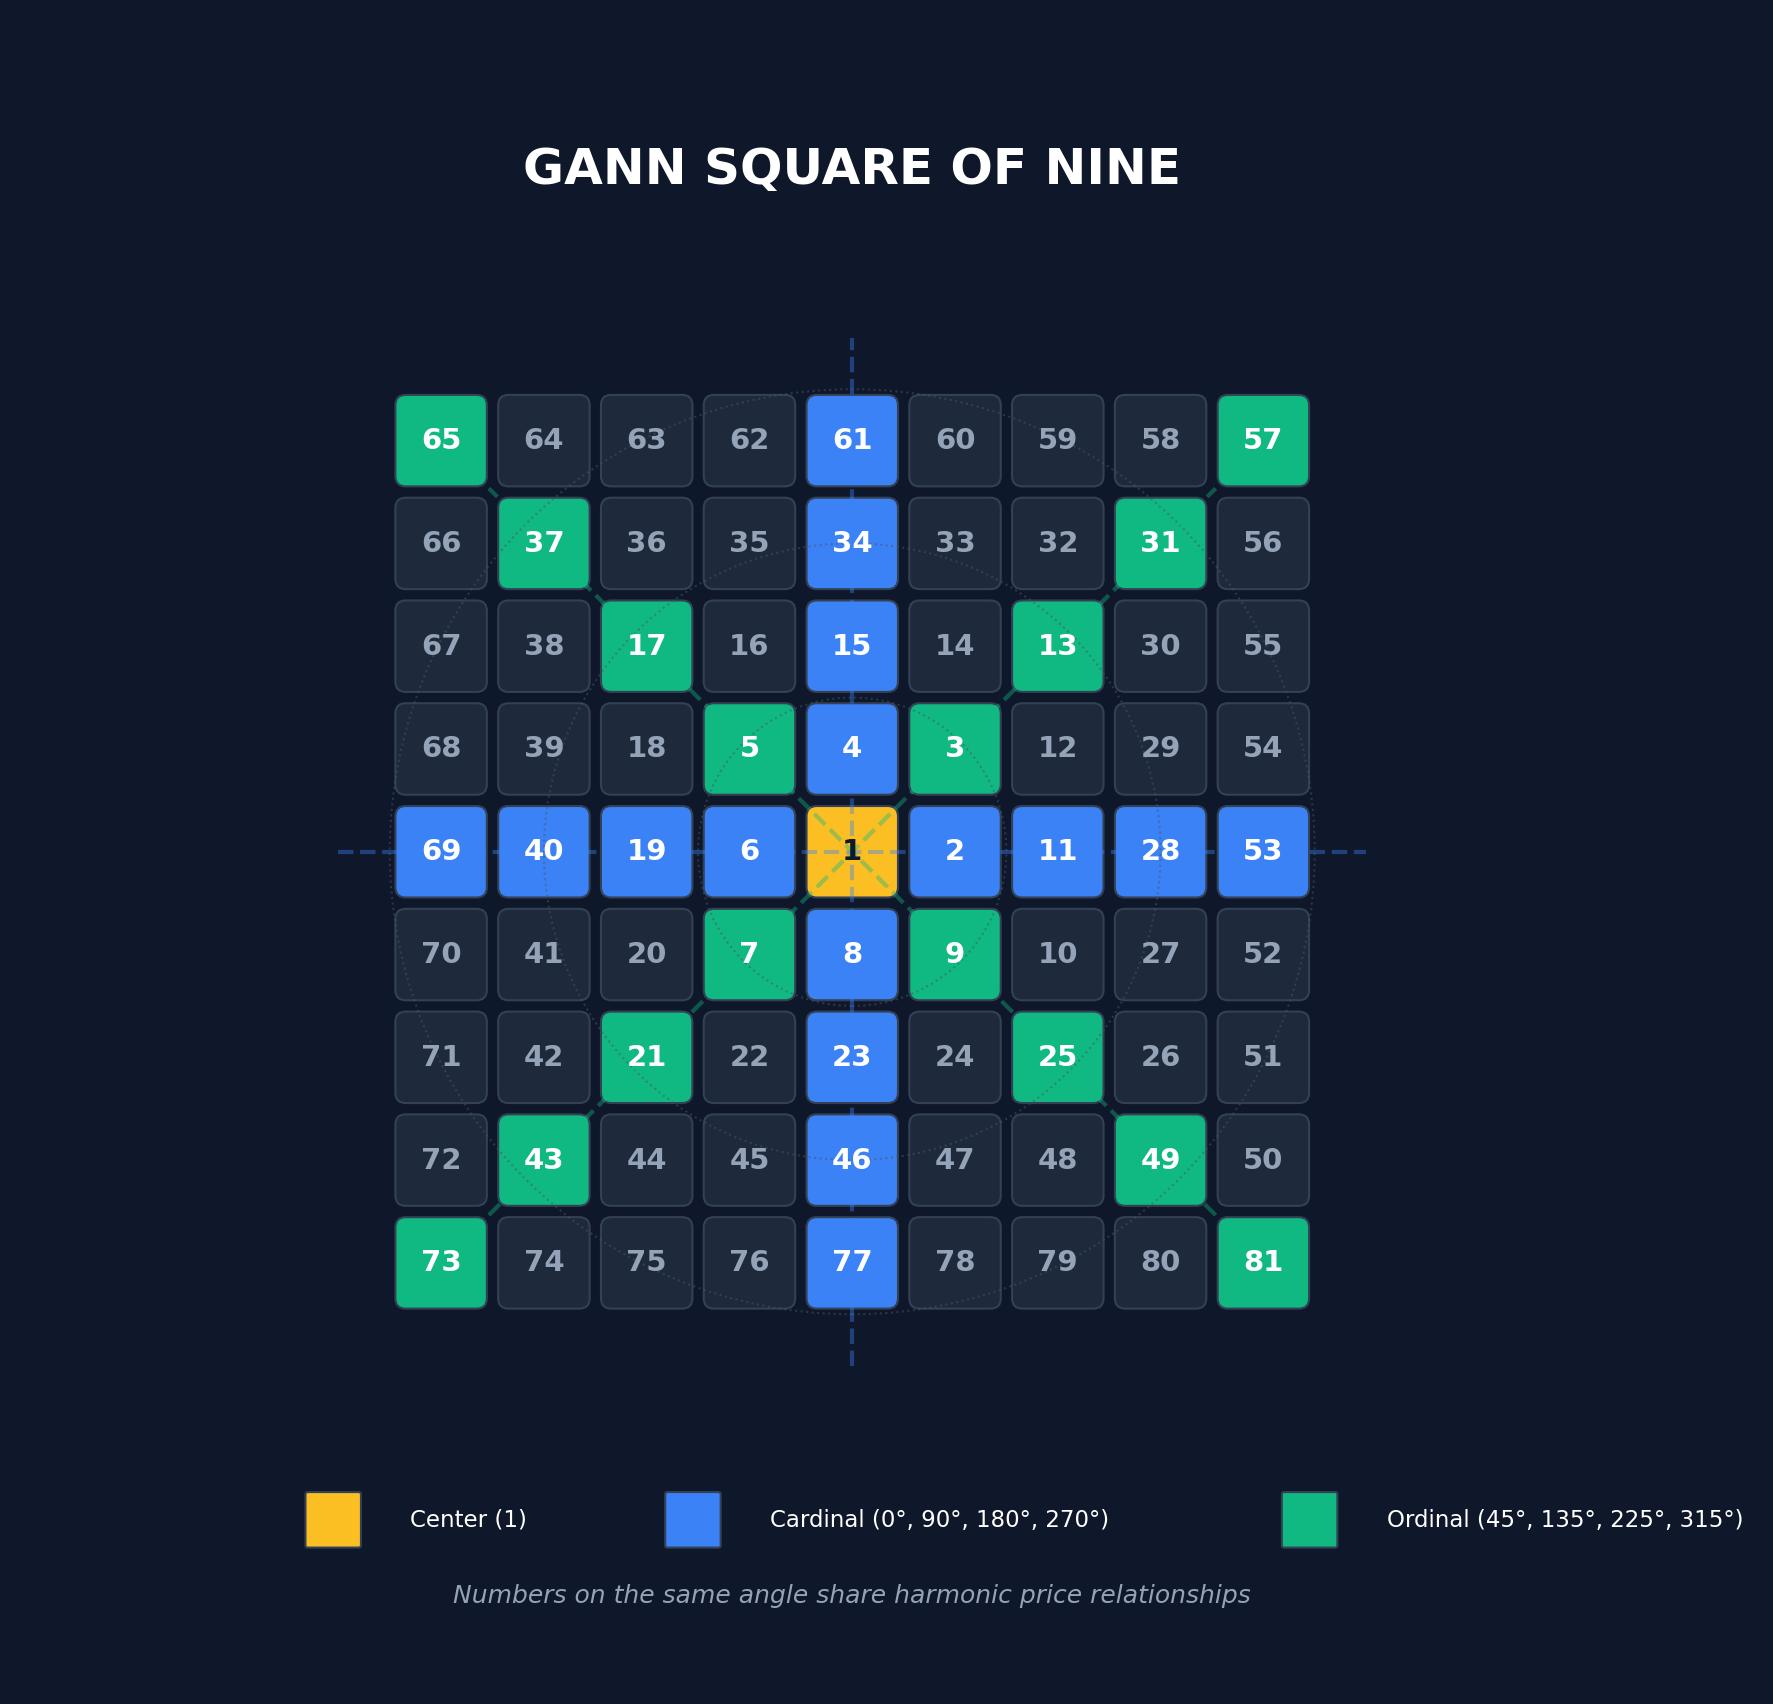
The Square of Nine
The Square of Nine is Gann’s most famous tool. It’s a spiral of numbers starting from 1 at the center, expanding outward in a specific pattern. Each complete rotation around the square represents a full cycle, and numbers on the same angle share harmonic relationships.
The structure places cardinal numbers (those falling on the cross: 0°, 90°, 180°, 270°) and ordinal numbers (on the X: 45°, 135°, 225°, 315°) as key support and resistance levels.
The Mathematical Foundation
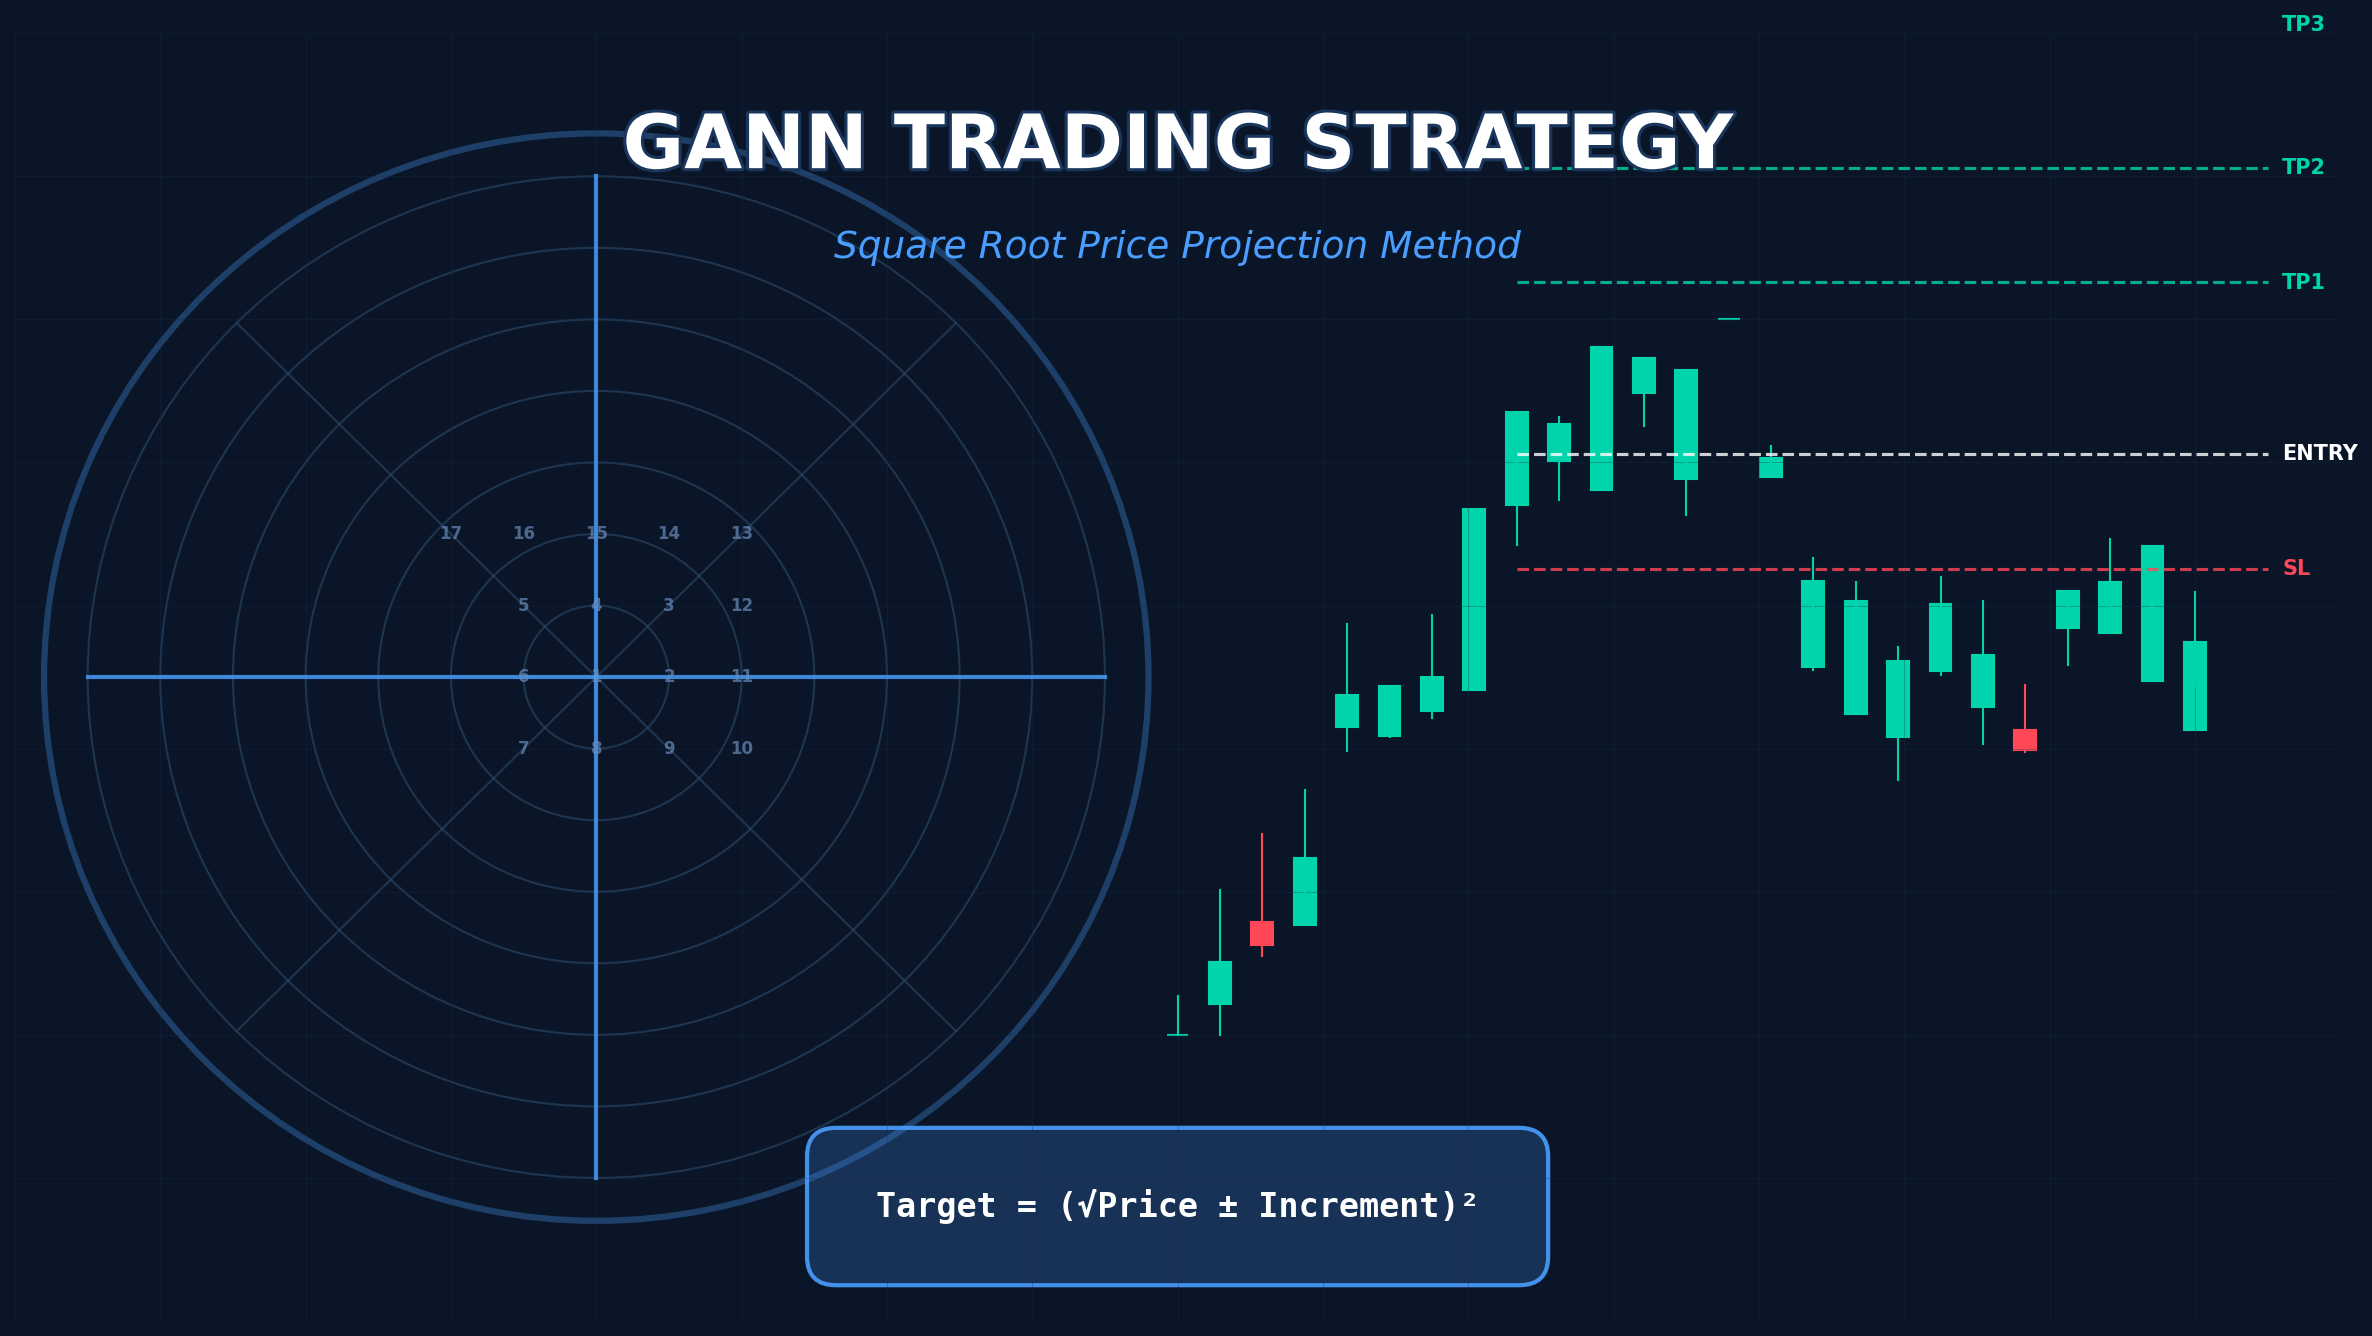
At its core, the Square of Nine is based on square root relationships. Numbers on the same angle of the square are related by their square roots. This observation gives us a powerful formula for calculating price projections:
Where the increment represents the number of “steps” around the square. A full rotation (360°) corresponds to an increment of 2.0, a half rotation (180°) is 1.0, a quarter rotation (90°) is 0.5, and so on.
Key Gann Increments
| Increment | Degrees | Significance |
|---|---|---|
| 0.125 | 22.5° | Minor support/resistance |
| 0.25 | 45° | Significant level (1/8 of circle) |
| 0.5 | 90° | Strong level (cardinal cross) |
| 1.0 | 180° | Major reversal level (opposition) |
| 2.0 | 360° | Complete cycle (full rotation) |
The Square Root Method Explained
Understanding the Calculation
The square root method works because price and time in markets follow natural mathematical progressions. When we take the square root of a price, add or subtract an increment, and square the result, we’re essentially moving around Gann’s Square of Nine to find harmonically related price levels.
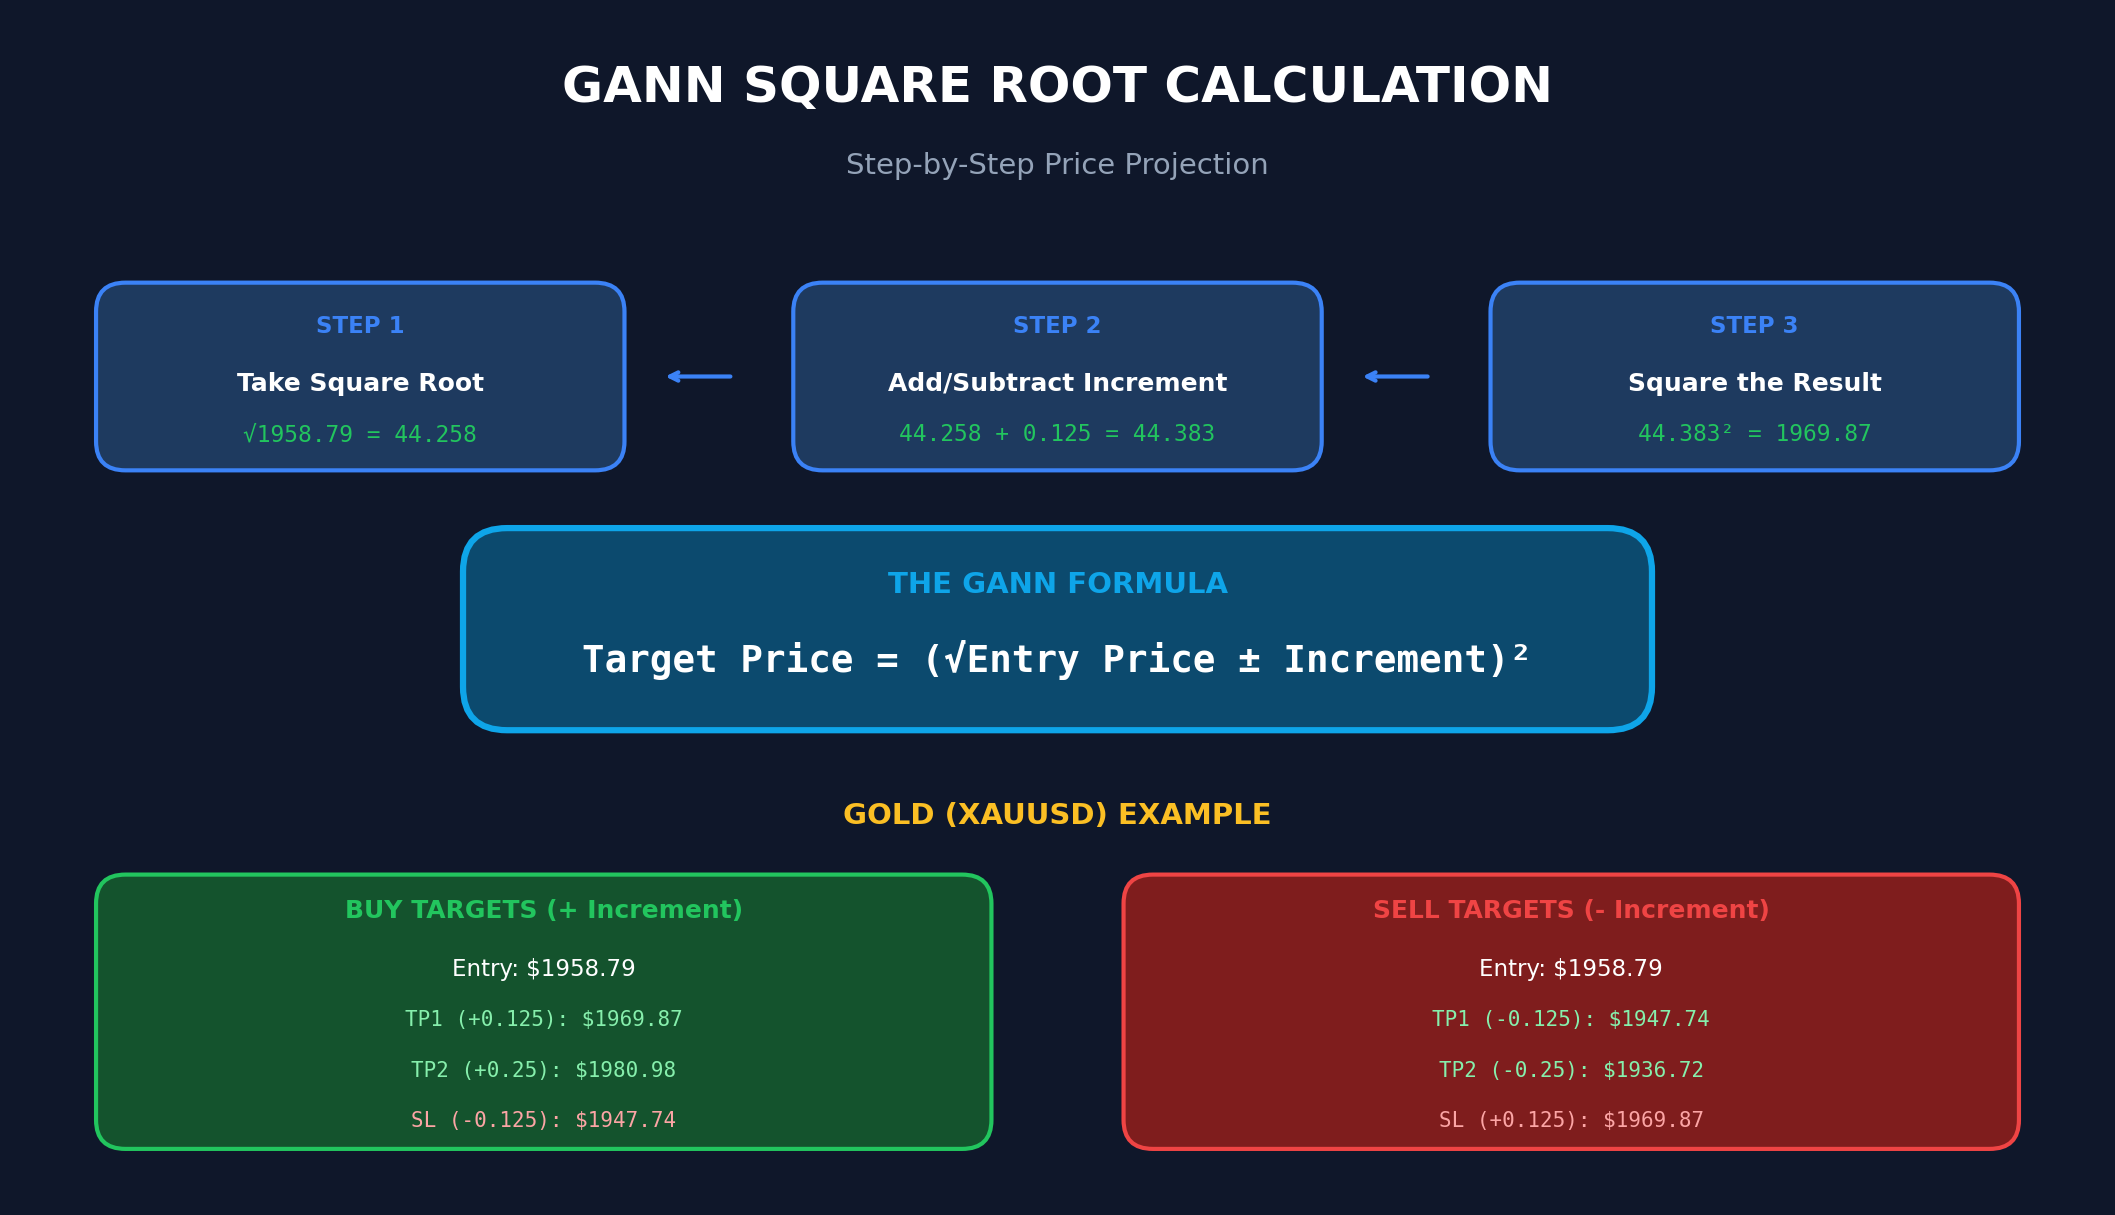
Step-by-Step Calculation
- Step 1: Take the square root of your reference price (signal level)
- Step 2: Add the increment for upward targets, subtract for downward targets
- Step 3: Square the result to get your target price
Practical Example: Gold (XAUUSD)
Let’s say gold forms a swing low at $1,958.79 (our signal level for a buy trade):
Base calculation:
√1958.79 = 44.258
Take Profit 1 (Increment 0.125):
(44.258 + 0.125)² = 44.383² = $1,969.85
Take Profit 2 (Increment 0.25):
(44.258 + 0.25)² = 44.508² = $1,980.96
Take Profit 3 (Increment 0.5):
(44.258 + 0.5)² = 44.758² = $2,003.28
Stop Loss (Increment 0.125 below):
(44.258 – 0.125)² = 44.133² = $1,947.72
The Trading Strategy
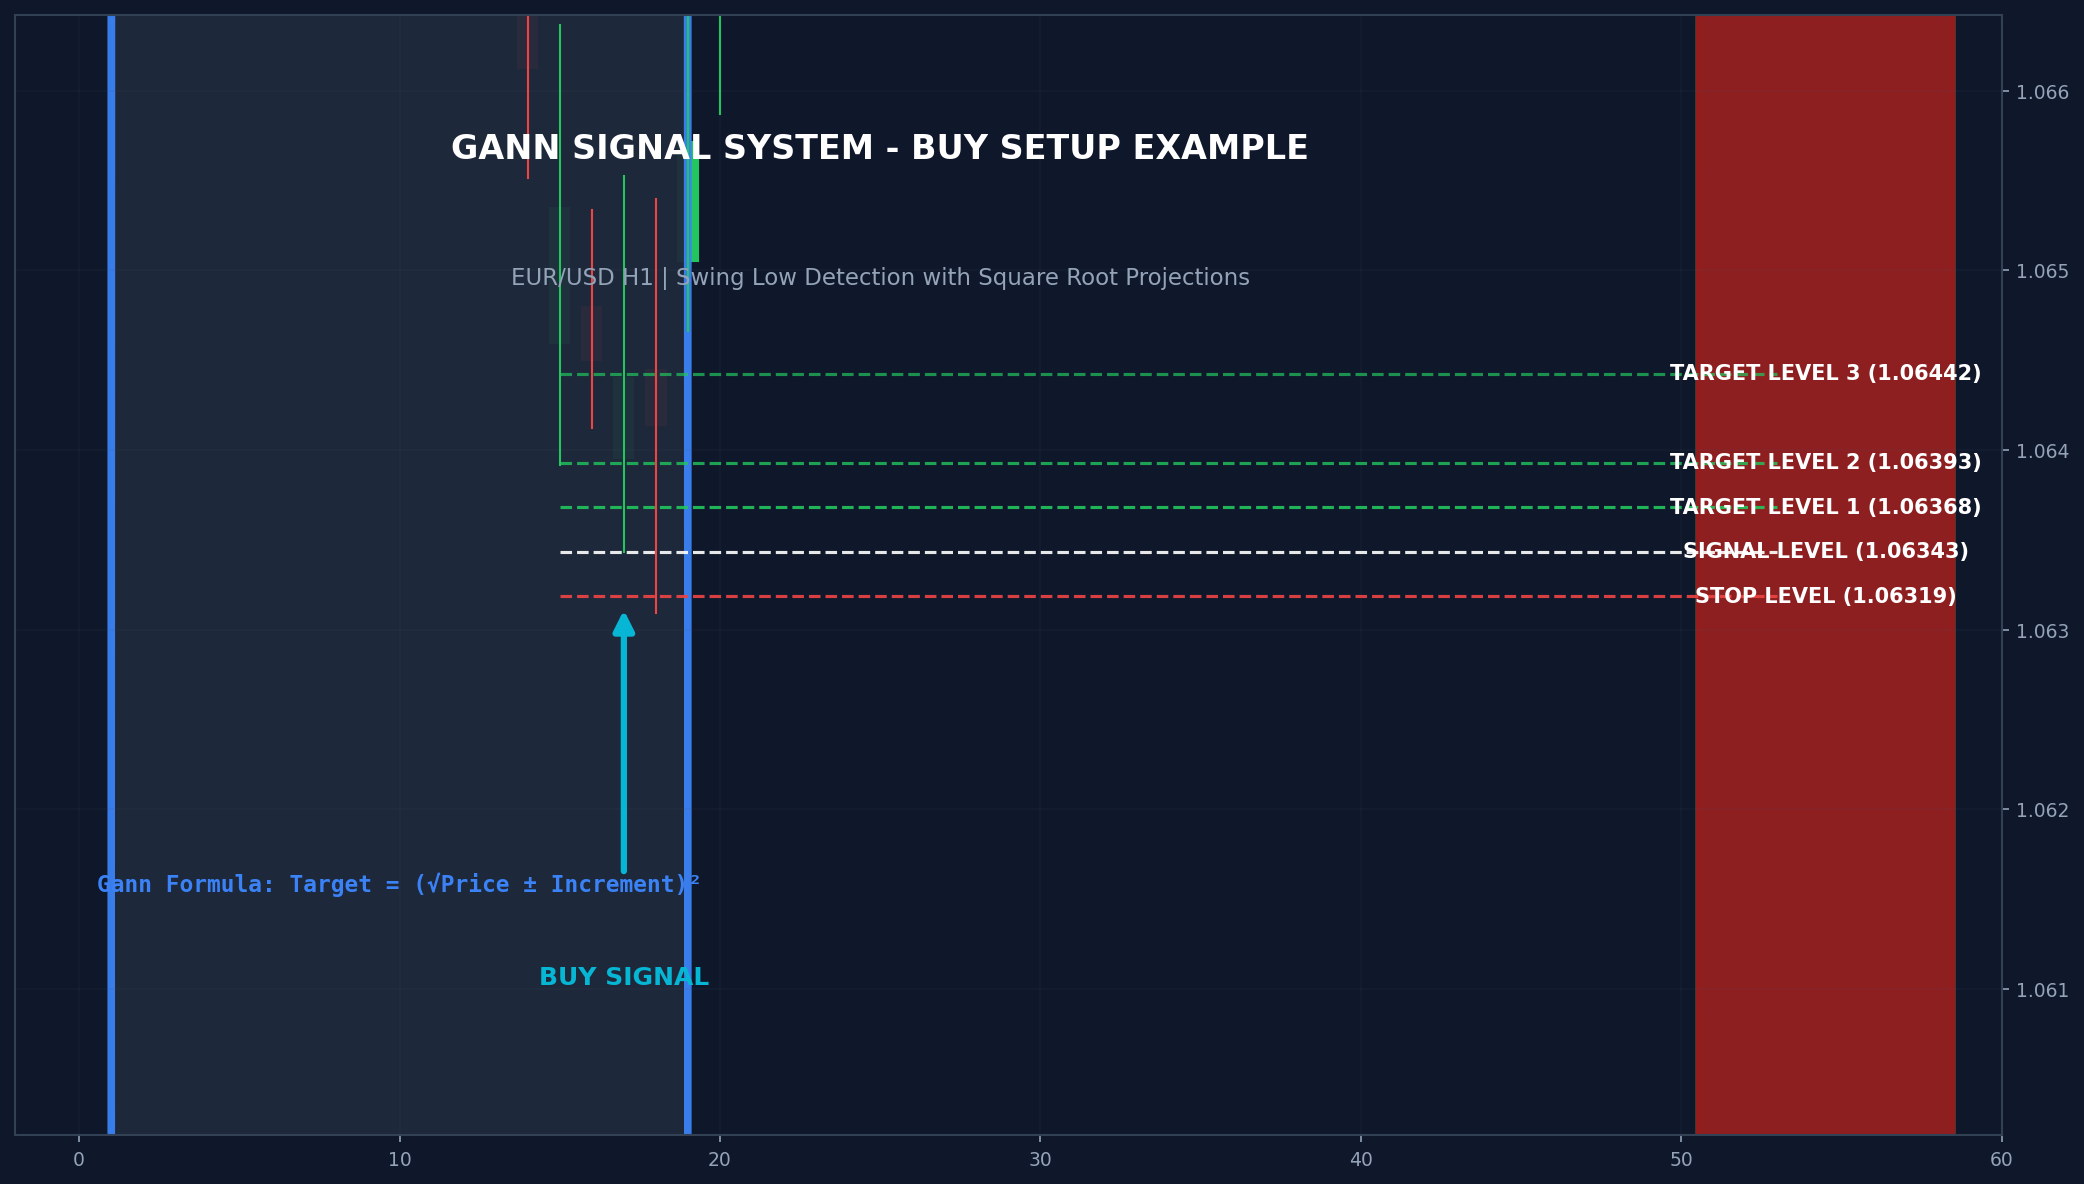
Signal Generation
The strategy identifies high-probability reversal points using swing high/low detection. A swing point is confirmed when price makes an extreme (high or low) that is not exceeded for a specified number of bars on both sides.
Buy Signal Conditions
- A confirmed swing low forms (price lower than N bars on each side)
- The swing must be confirmed by subsequent price action (non-repainting)
- Entry is at the low of the swing candle
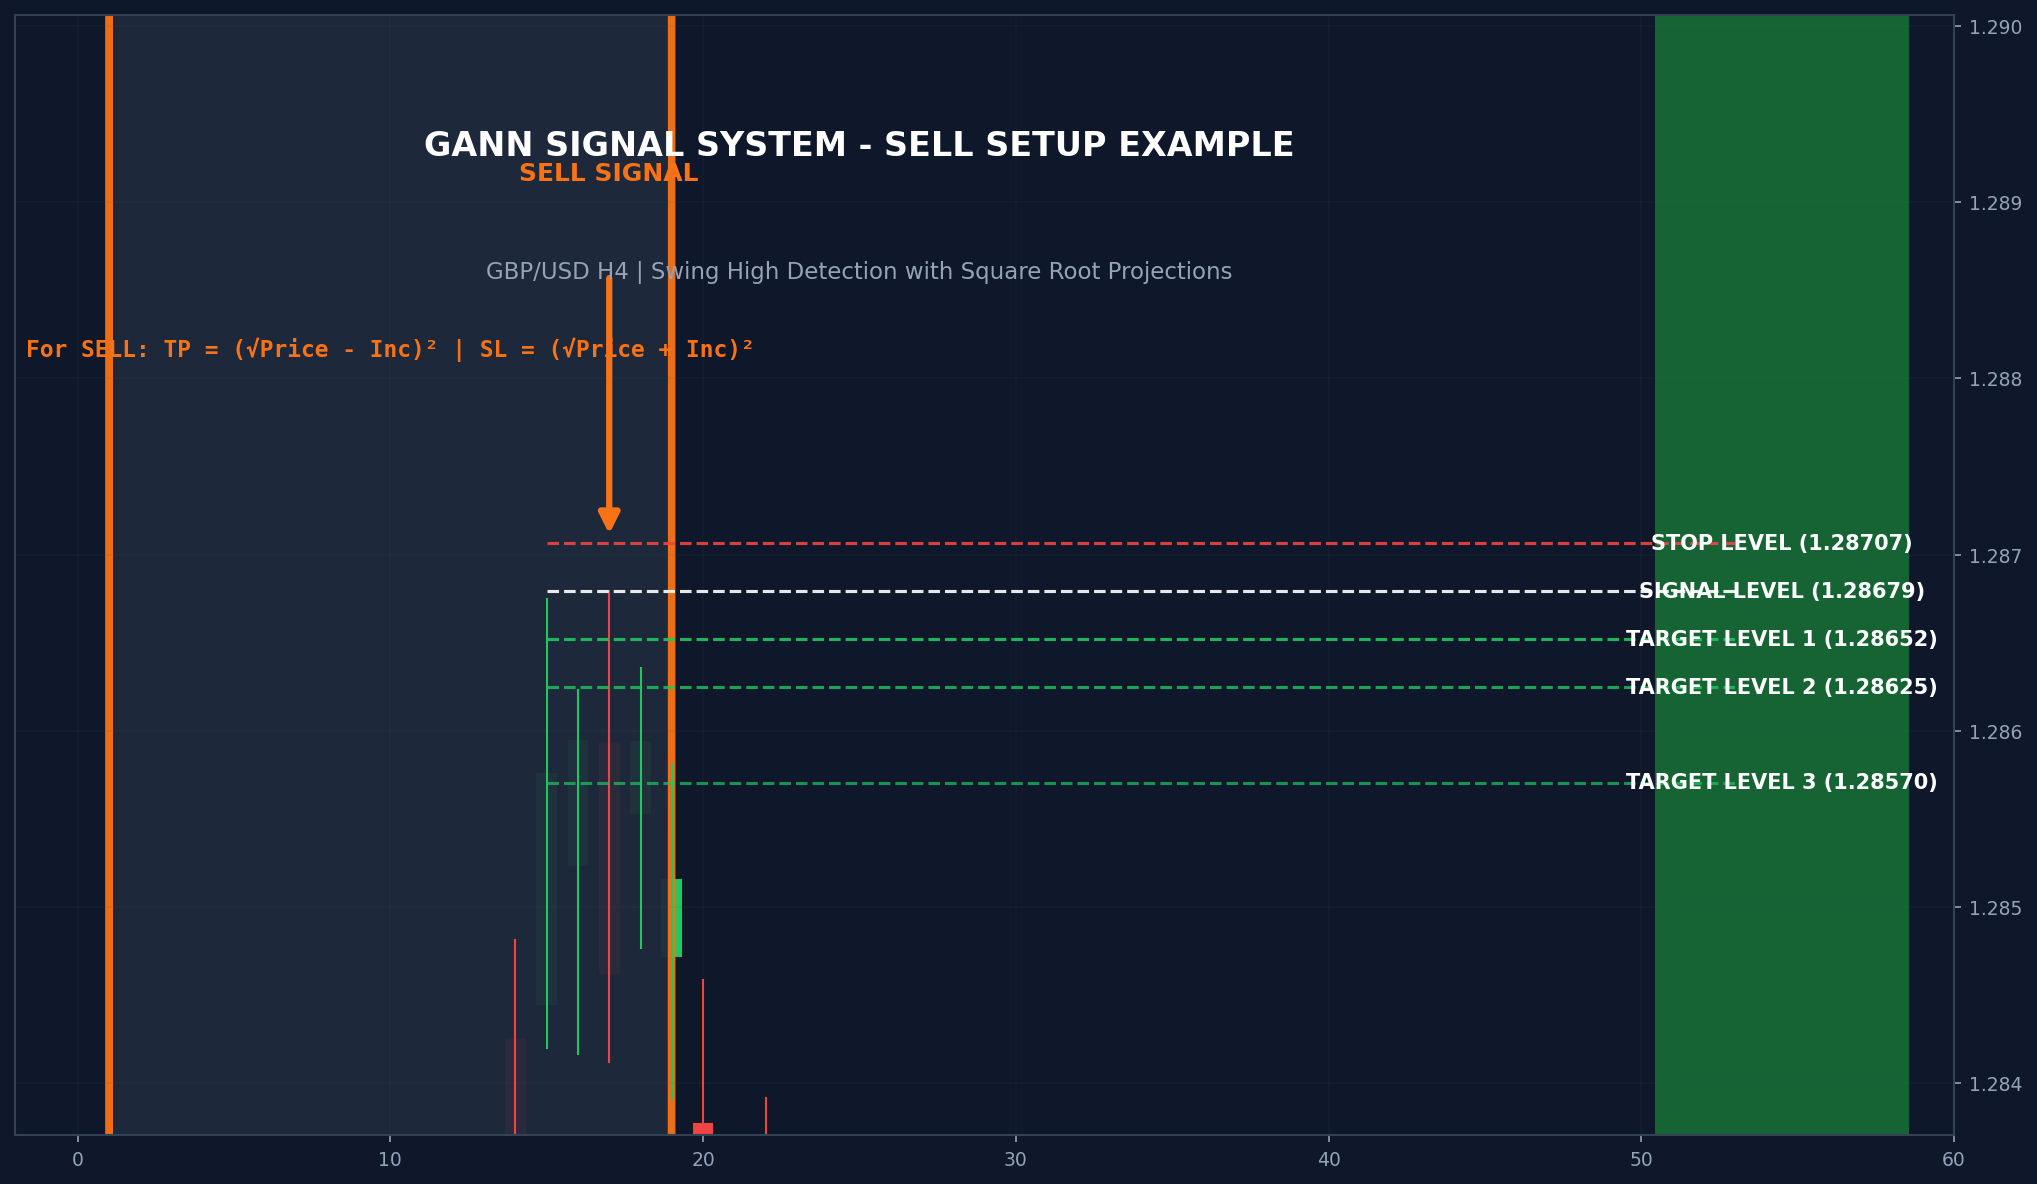
Sell Signal Conditions
- A confirmed swing high forms (price higher than N bars on each side)
- The swing must be confirmed by subsequent price action (non-repainting)
- Entry is at the high of the swing candle
Non-Repainting Logic
A critical feature of this strategy is its non-repainting nature. Many indicators show signals during price formation that later disappear or move. This strategy only plots signals after the swing is fully confirmed, meaning the required number of bars have closed after the swing point.
While this introduces a slight delay, it ensures that once a signal appears, it never changes or disappears.
Level Projection Summary
| Level | Buy Trade | Sell Trade |
|---|---|---|
| Signal | Swing Low price | Swing High price |
| Stop Loss | (√Price – SL_Inc)² | (√Price + SL_Inc)² |
| TP1 | (√Price + Inc1)² | (√Price – Inc1)² |
| TP2 | (√Price + Inc2)² | (√Price – Inc2)² |
| TP3 | (√Price + Inc3)² | (√Price – Inc3)² |
Risk Management
Position Sizing
The indicator displays the pip distance to the stop loss level, enabling proper position sizing. Use the following formula:
Example: With a $10,000 account risking 2% on a trade with a 50-pip stop loss on EUR/USD (pip value $10 per standard lot):
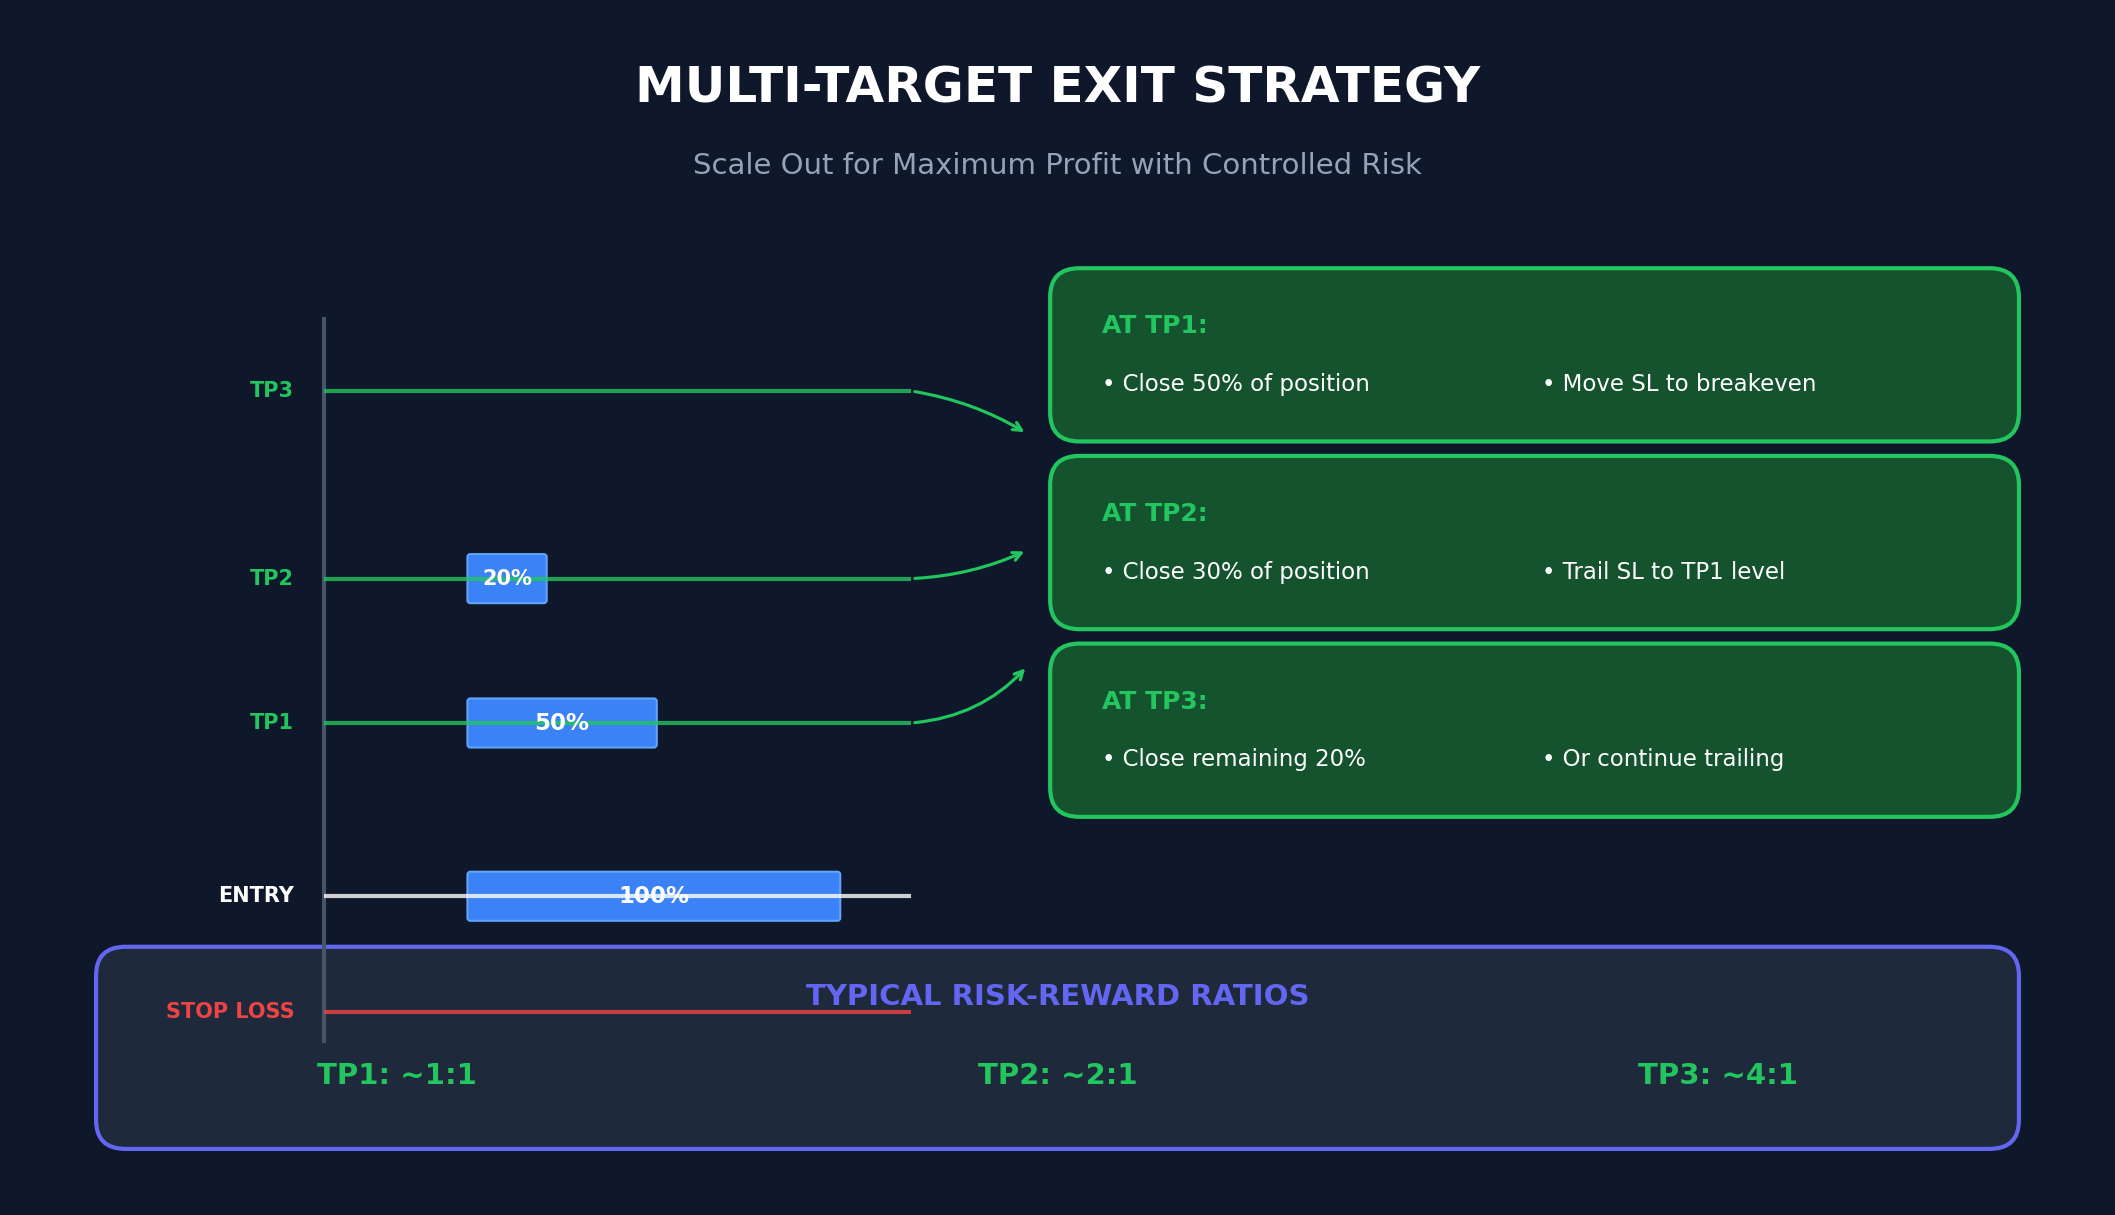
Multi-Target Exit Strategy
The three take profit levels allow for a scaled exit approach, which balances capturing profits with allowing winners to run:
| Target | Action | Stop Management |
|---|---|---|
| TP1 | Close 50% of position | Move stop to breakeven |
| TP2 | Close 30% of position | Trail stop to TP1 level |
| TP3 | Close remaining 20% | Or continue trailing |
Risk-Reward Ratios
Because the Gann levels are mathematically derived from the same starting point, the risk-reward ratios are inherently balanced. With the default increment settings:
- TP1: ~1:1 ratio
- TP2: ~2:1 ratio
- TP3: ~4:1 ratio
Optimization Guidelines
Adjusting for Different Instruments
The Gann increment values need to be adjusted based on the typical price range of the instrument. Higher-priced instruments need larger increments to produce meaningful target distances.
| Instrument | TP1 Inc | TP2 Inc | TP3 Inc | SL Inc |
|---|---|---|---|---|
| Forex Majors | 0.05-0.15 | 0.10-0.25 | 0.20-0.50 | 0.10-0.15 |
| Gold (XAUUSD) | 0.5-1.0 | 1.0-2.0 | 2.0-4.0 | 0.5-1.0 |
| Stock Indices | 1.0-2.0 | 2.0-4.0 | 4.0-8.0 | 1.0-2.0 |
| Crypto (BTC) | 5.0-10.0 | 10.0-20.0 | 20.0-40.0 | 5.0-10.0 |
Swing Strength by Timeframe
The swing strength parameter determines how significant a swing point must be. Lower values produce more signals but with lower quality. Higher values produce fewer but more reliable signals.
| Timeframe | Swing Strength | Trading Style |
|---|---|---|
| M1-M5 | 3-5 | Scalping |
| M15-H1 | 5-8 | Day Trading |
| H4-D1 | 5-10 | Swing Trading |
| W1-MN | 3-5 | Position Trading |
Why Gann Methods Work
The Self-Fulfilling Prophecy
One reason Gann levels work is simply because many traders watch them. When enough market participants expect price to react at a certain level, their collective actions (taking profits, entering trades, placing stops) create the very reaction they anticipated. This is especially true for well-known Gann levels derived from major swing points.
Mathematical Harmony
Markets, like many natural phenomena, exhibit mathematical patterns. Square root relationships appear throughout nature, from the spiral of a nautilus shell to the distribution of sunflower seeds. Gann believed these same natural laws govern price movement, and there is empirical evidence that markets do tend to respect geometric and harmonic levels.
Volatility Adaptation
The square root method naturally adapts to price levels. A higher-priced instrument produces wider target ranges, while a lower-priced instrument produces tighter ranges. This inherent scaling makes Gann methods applicable across any market without fundamental changes to the calculation.
Limitations and Caveats
No trading method is perfect, and Gann techniques are no exception:
Not predictive: Gann levels identify potential support/resistance, not certainties. Price may blow through levels or reverse before reaching them.
Context matters: Gann levels work best when combined with other analysis: trend direction, market structure, volume, and fundamental context.
Parameter sensitivity: Results vary based on increment choices. What works on one instrument may not work on another.
Market conditions: Range-bound markets produce many whipsaw signals. The strategy works better in trending or clearly reversing conditions.
Combining Gann with Other Analysis
Trend Filters
For higher probability trades, consider only taking:
- Buy signals when price is above a 50 or 200 period moving average
- Sell signals when price is below a 50 or 200 period moving average
Support/Resistance Confluence
Gann levels that align with the following tend to be stronger and more likely to hold:
- Previous swing highs/lows
- Round numbers (1.1000, 1900.00)
- Fibonacci retracements
- Pivot points
Quick Reference Card
The Formula
Target = (√Price ± Increment)²
Default Increments
- TP1: +0.125 (buy) / -0.125 (sell)
- TP2: +0.25 (buy) / -0.25 (sell)
- TP3: +0.5 (buy) / -0.5 (sell)
- SL: -0.125 (buy) / +0.125 (sell)
Signal Rules
- Wait for confirmed swing (non-repainting)
- Enter at signal level
- Place stop at SL level
- Scale out at TP1, TP2, TP3
Risk Management
- Risk 1-2% per trade maximum
- Move to breakeven at TP1
- Trail stop as price advances
Conclusion
W.D. Gann’s square root method provides a mathematically elegant approach to identifying price targets. By understanding that markets move in geometric progressions, traders can anticipate levels where price is likely to find support, resistance, or reversal.
The Gann Signal System indicator automates these calculations, providing clear entry signals with pre-calculated stop loss and take profit levels. By using non-repainting swing detection and authentic Gann projections, it offers a transparent and reliable tool for traders who want to incorporate Gann methodology into their trading.
As with any trading approach, success depends on proper risk management, patience for quality setups, and the discipline to follow your trading plan. The indicator provides the signals; it remains the trader’s responsibility to execute with discipline and manage risk appropriately.
Download the Free Gann Signal System Indicator
Get the MT4 and MT5 versions of this indicator.
Risk Disclaimer: Trading foreign exchange and other financial instruments carries a high level of risk and may not be suitable for all investors. Past performance is not indicative of future results. The information provided in this guide is for educational purposes only and should not be considered financial advice. Always conduct your own research and consult with a qualified financial advisor before making any investment decisions.
Cooming next: Gann Angles Explained – How to Use the Square of Nine – Swing Trading Strategies – Risk Management for Forex Traders