
Understanding W.D. Gann’s Square Root Method for Price Projection
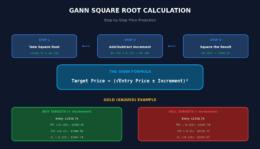
Understanding W.D. Gann’s Square Root Method for Price Projection

There is no excerpt because this is a protected post.

It’s apparent to most of us now that DeFi is a model that investor like, a lot. They like the ability to control their own finances; they like the ability to deal on a level playing field with other investors.

Wyckoff analysis was born out of years of practical study of the stock price boom and bust cycles. Its founder, Richard D. Wyckoff was a profound observer of the markets.

A spinning top is a Japanese candlestick pattern that denotes indecision in the market, usually at the end of a trend. It can warn of price reversal.

In an era of instant financial news and social media updates, an abundance of information is freely available to us at any given time. All of us rely on information to make sound trading decisions.

A high wave candlestick is considered a price reversal but is not associated with a specific direction. As a standard rule if the body is black it is taken as bearish, while if it is white it is treated as bullish.

The advance block is a three bar pattern that is usually taken as a bearish reversal signal. The pattern appears as a block of three white, rising candlesticks, each with a shorter body than the last.

Markets never go in a straight line, in either direction. One question then that a trader has to ask is at what level to expect a retracement, aka a pullback. Failing to account for retracement can either result in missing out on profits, by exiting the trade too soon.