

Pivot lines tell you where the price of a financial instrument is likely to meet support and resistance. Pivots are therefore potential turning points. They are used as a mainstay by many technical traders. Knowing the location of pivot lines in any currency pair or instrument you are trading is therefore extremely useful.
This free Metatrader chart indicator will keep you aware of these lines of support and resistance. In summary this indicator will:
- Display and update the pivot levels on the chart
- Option to display or hide historical pivot lines
- Calculates three main pivot types: Standard, Fibonacci, and Camarilla
- Alerts when price approaches a pivot resistance or support line
- Time shift option so you can use any opening/closing time zone
Pivot Modes
The chart below shows pivot levels drawn on the daily chart (D1). The solid red line depicts the main pivot axis. The lines above are resistances, and the lines below are supports. The leading solid lines are the prediction levels. These show the likely price range for the day, according to the pivot model.

There are three main pivot calculation methods: Standard, Fibonacci and Camarilla. The indicator will give the option to use either of these.
The figure above shows the indicator in standard mode.
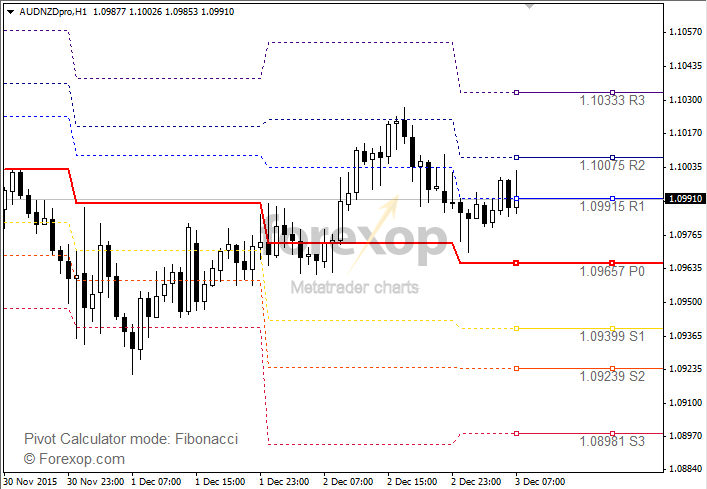
Figure 2 below shows the Fibonacci pivot levels on the AUDNZD hourly chart. One difference in the calculation modes is that both Fibonacci and Camarilla are always symmetric around the central pivot axis whereas this is not always the case with the standard pivots.
Time Zone and Time Shift
Pivot levels are calculated using the open/close prices and the range of the previous day. Since forex is a “round the clock” market, by convention the pivot reference point is usually the London close as this is by far the biggest market.
The time shift option lets you align the pivot calculations with any market you choose. So let’s say your local Metatrader time zone is GMT+4 and you want to use the London market as the point of reference. The chart time is four hours ahead of London time. To use GMT end of day as the reference point, you would set
Time shift = +4 hours
The indicator will now use end of day, GMT as its reference time.
If you wanted to use end of market at 17.00 London time say, you would enter:
Time shift = +11 hours
The indicator will now use 17.00 GMT as the open/close reference time. Use this setting to align with any market and closing time as required.

Alerts
The indicator can alert you whenever the price approaches one of the pivot levels. The alert created will tell you which pivot level the price is close to. This is useful if you’re waiting for a particular support or resistance level to be reached before entering the market. To switch alerts on, use setting:
Alerts when price crosses pivot line: None, Terminal Alert, SMS, Email
By default, this setting is off. When switched on, an alert will be sent whenever the price is closer than a threshold you provide (in pips). Use this setting to control when the indicator will alert you. For example:
Threshold for alerts: 100 points
This will send an alert whenever the price is closer than ±10 pips to any pivot line.

Full Settings
Pivot calculation type: Choose standard, Fibonacci, or Camarilla
Display historical pivot lines on chart? If no, will just display leading pivots
Display pivot text labels on chart: If no, the pivot labels will not be shown
Maximum history bars (zero for all): When zero, the entire history is processed
Time shift from local time (hours): Use this to align with open/close of a particular market
Alert when price crosses pivot lines: Switch alerts on or off
Threshold for alerts (pips): The alert threshold (in pips)

To learn about pivot and trading and more about using this indicator see this article.
Compatible with Metatrader 4 and Metatrader 5.


